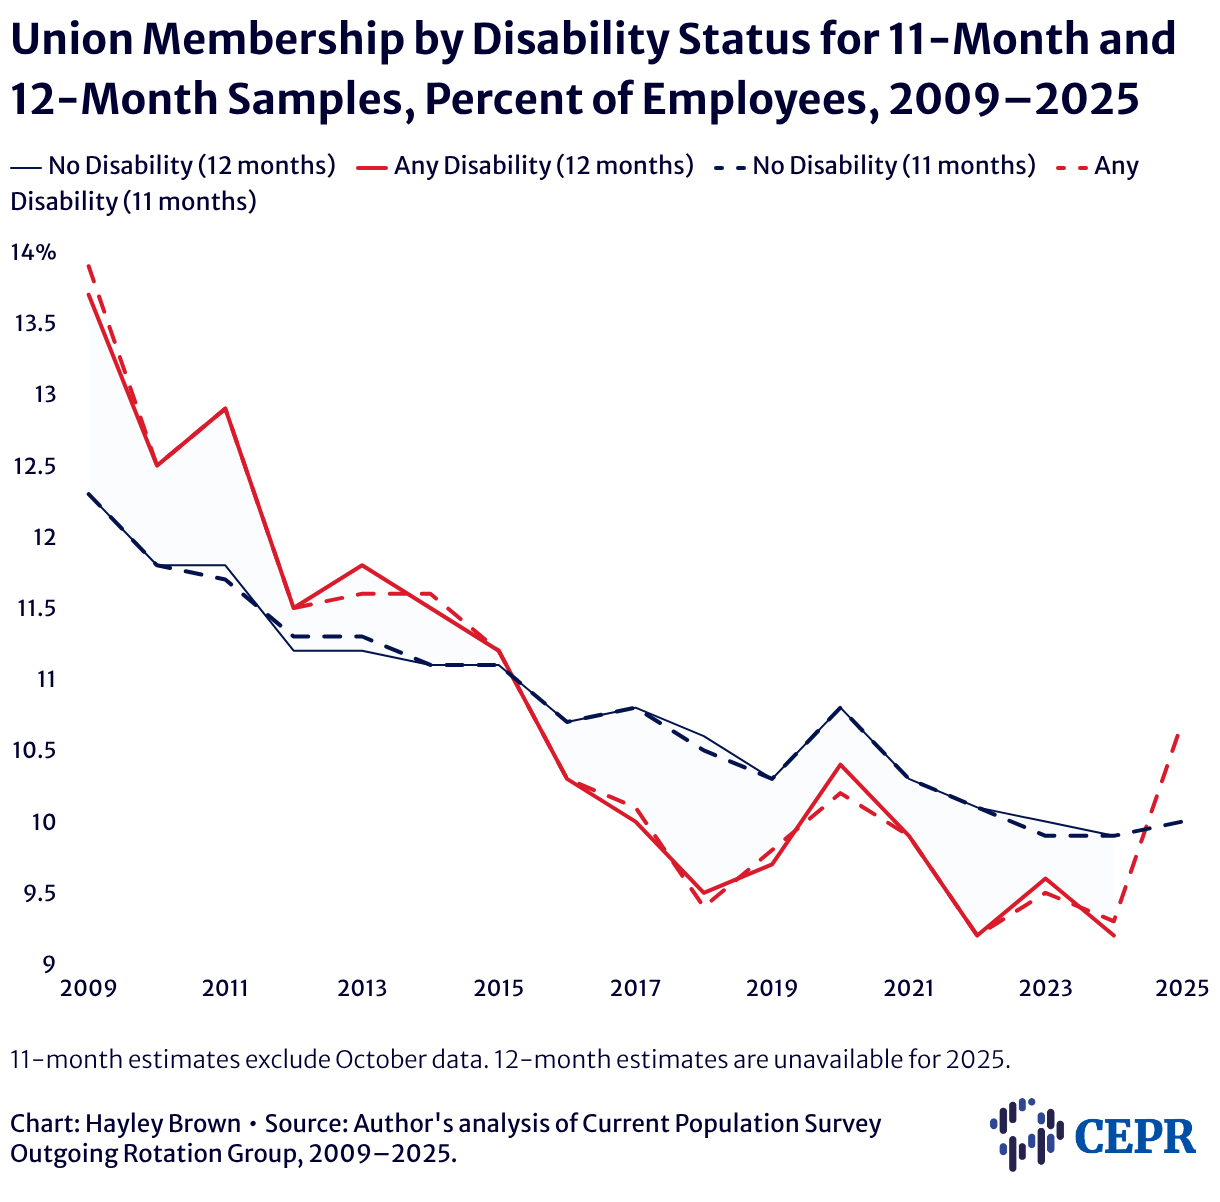
Union Membership by Disability Status for 11-Month and 12-Month Samples, Percent of Employees, 2009–2025
Line chart comparing union membership rates by disability status using 12-month (solid) and 11-month (dashed) samples from 2009 to 2025. Workers with disabilities are red and those without disabilities dark navy. Dashed lines closely mirror solid lines throughout, but with slightly larger gaps than other demographic groups, potentially due to smaller sample sizes.

11-month estimates exclude October data. 12-month estimates are unavailable for 2025.