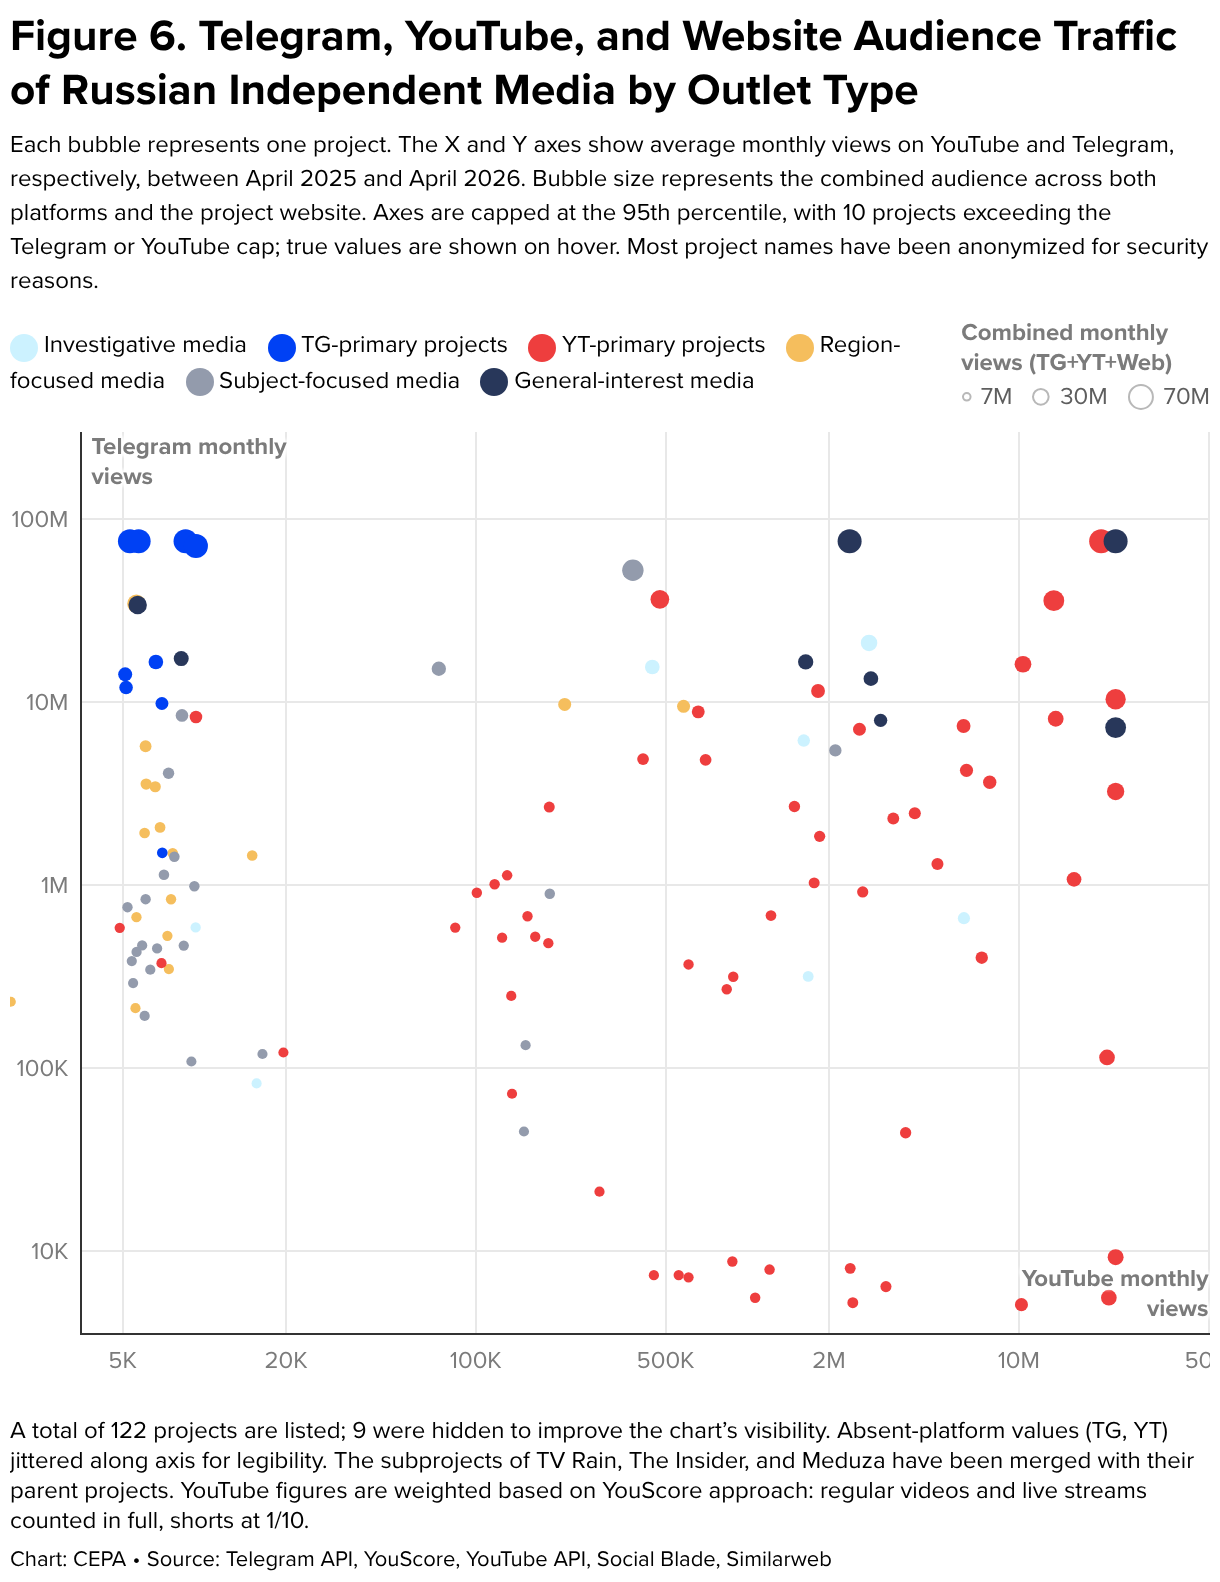
Figure 6. Telegram, YouTube, and Website Audience Traffic of Russian Independent Media by Outlet Type
Each bubble represents one project. The X and Y axes show average monthly views on YouTube and Telegram, respectively, between April 2025 and April 2026. Bubble size represents the combined audience across both platforms and the project website. Axes are capped at the 95th percentile, with 10 projects exceeding the Telegram or YouTube cap; true values are shown on hover. Most project names have been anonymized for security reasons.
