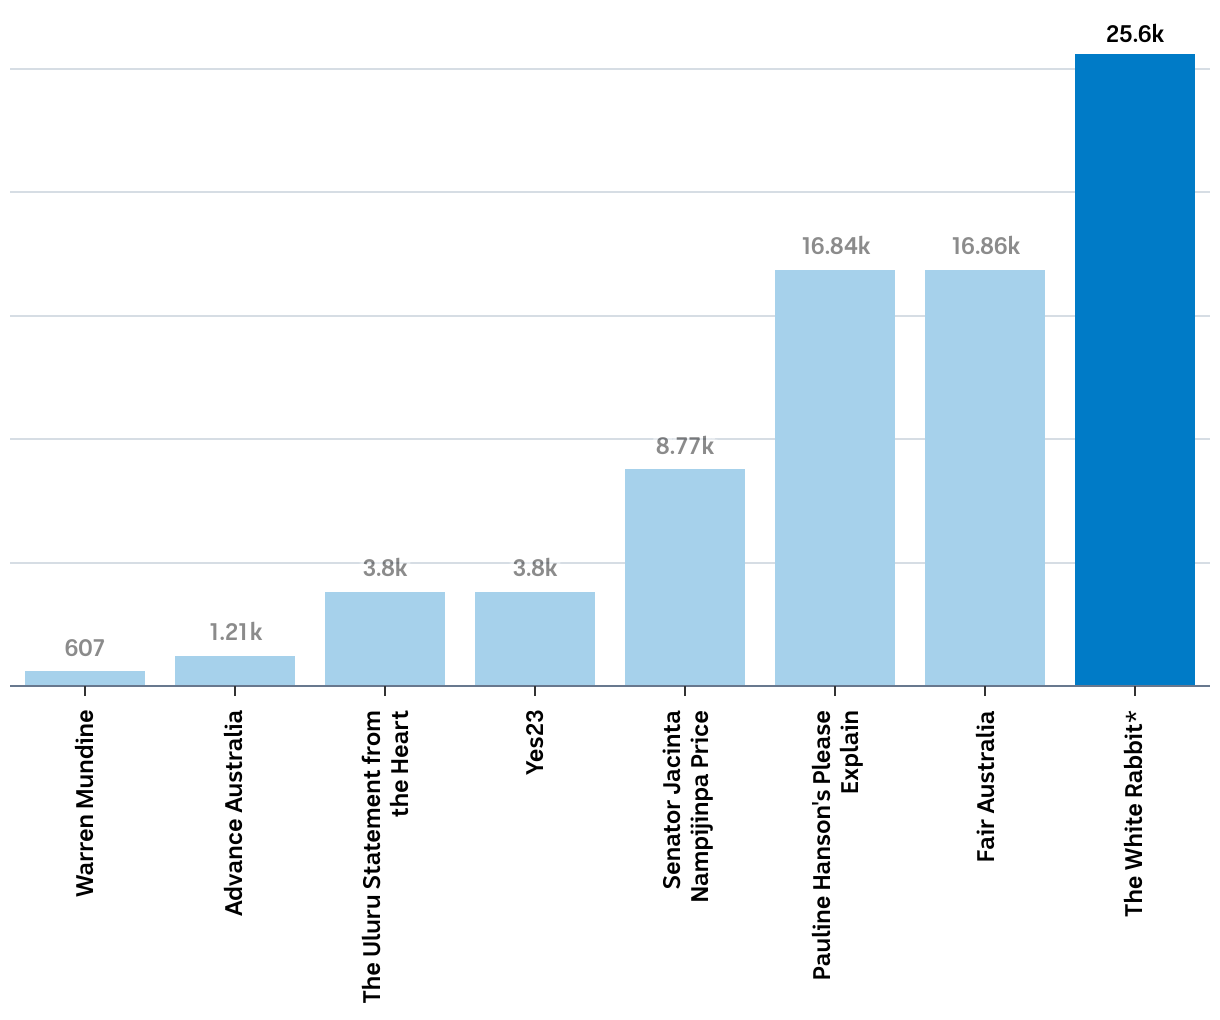
The video's shares compared to the most shared post from each official campaigners' Facebook page
A graph showing 7 columns in blue that are ascending in height left to right, with the last one being double the height of the second last.
(Please use a modern browser to see the interactive version of this visualization)