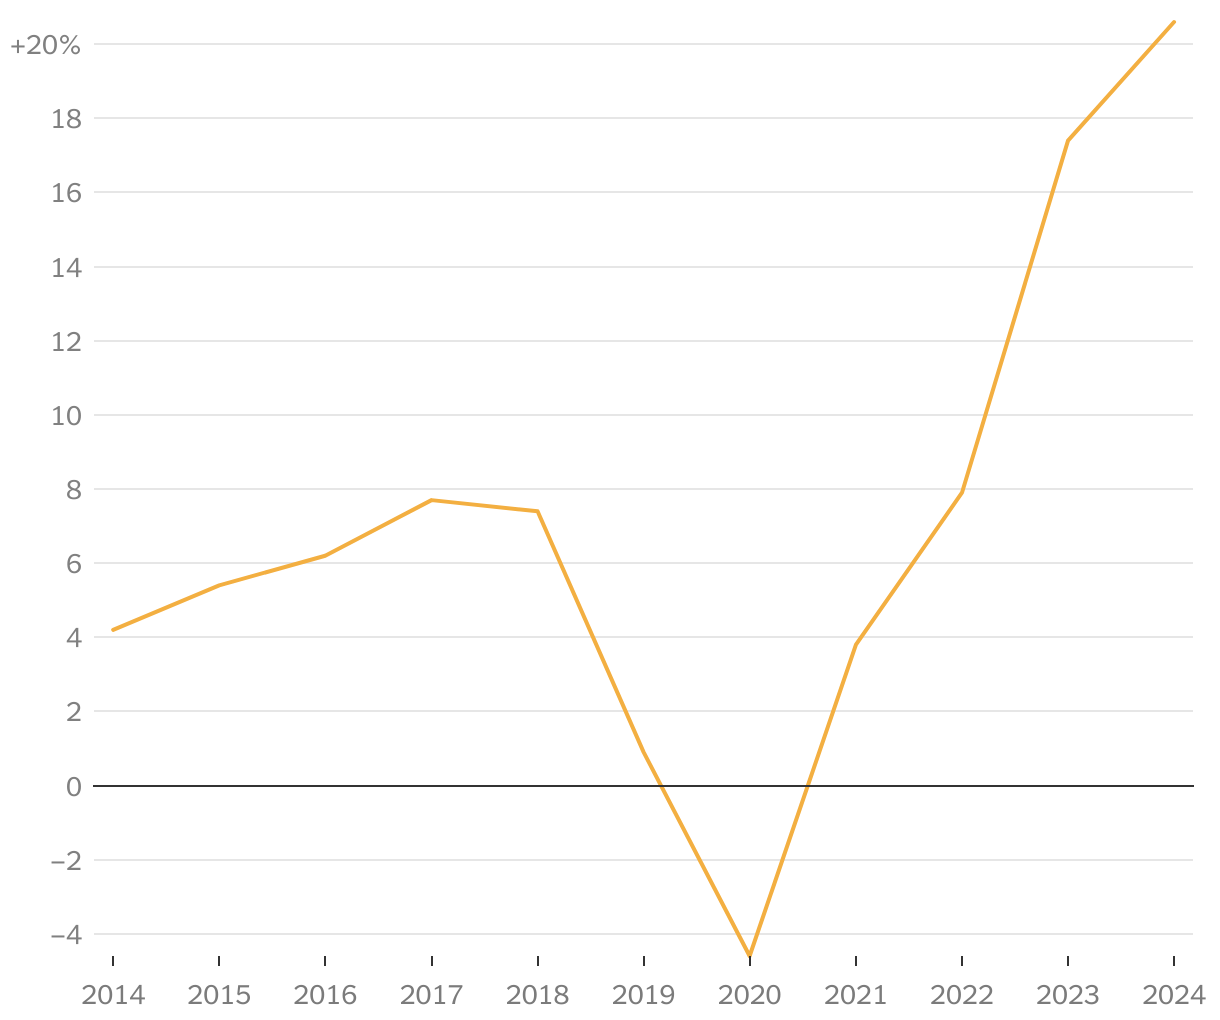
The annual change in the cost of car insurance
A line chart showing the annual percentage change in car insurance costs shows a steady rise in the last decade, a sharp dip just before the pandemic, and a quick increase since.
(Please use a modern browser to see the interactive version of this visualization)