Some demographic groups were more likely to have worked in the 2 years before experiencing homelessness than other demographic groups
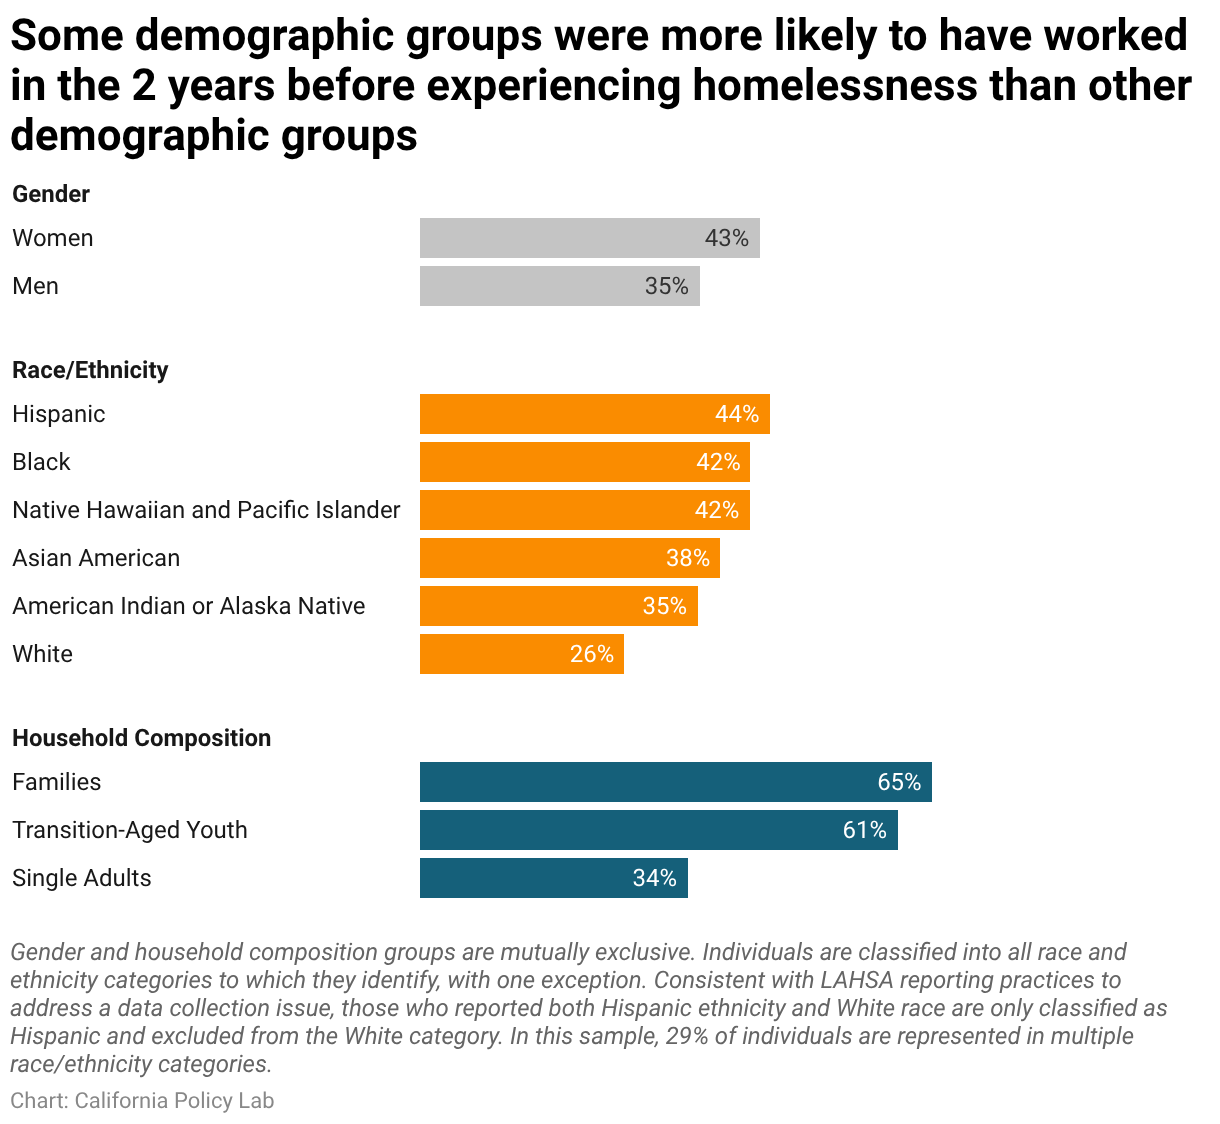
Bar chart showing employment rates in the two years before enrollment by demographic group. Women (43%) had higher employment rates than men (35%). White (26%) and American Indian or Alaska Native individuals (35%) had lower employment rates than Hispanic (44%), Black (42%), Native Hawaiian and Pacific Islander (42%), and Asian American (38%) individuals. Members of families (65%) and transition age youth (61%) had higher employment rates than single adults (34%).