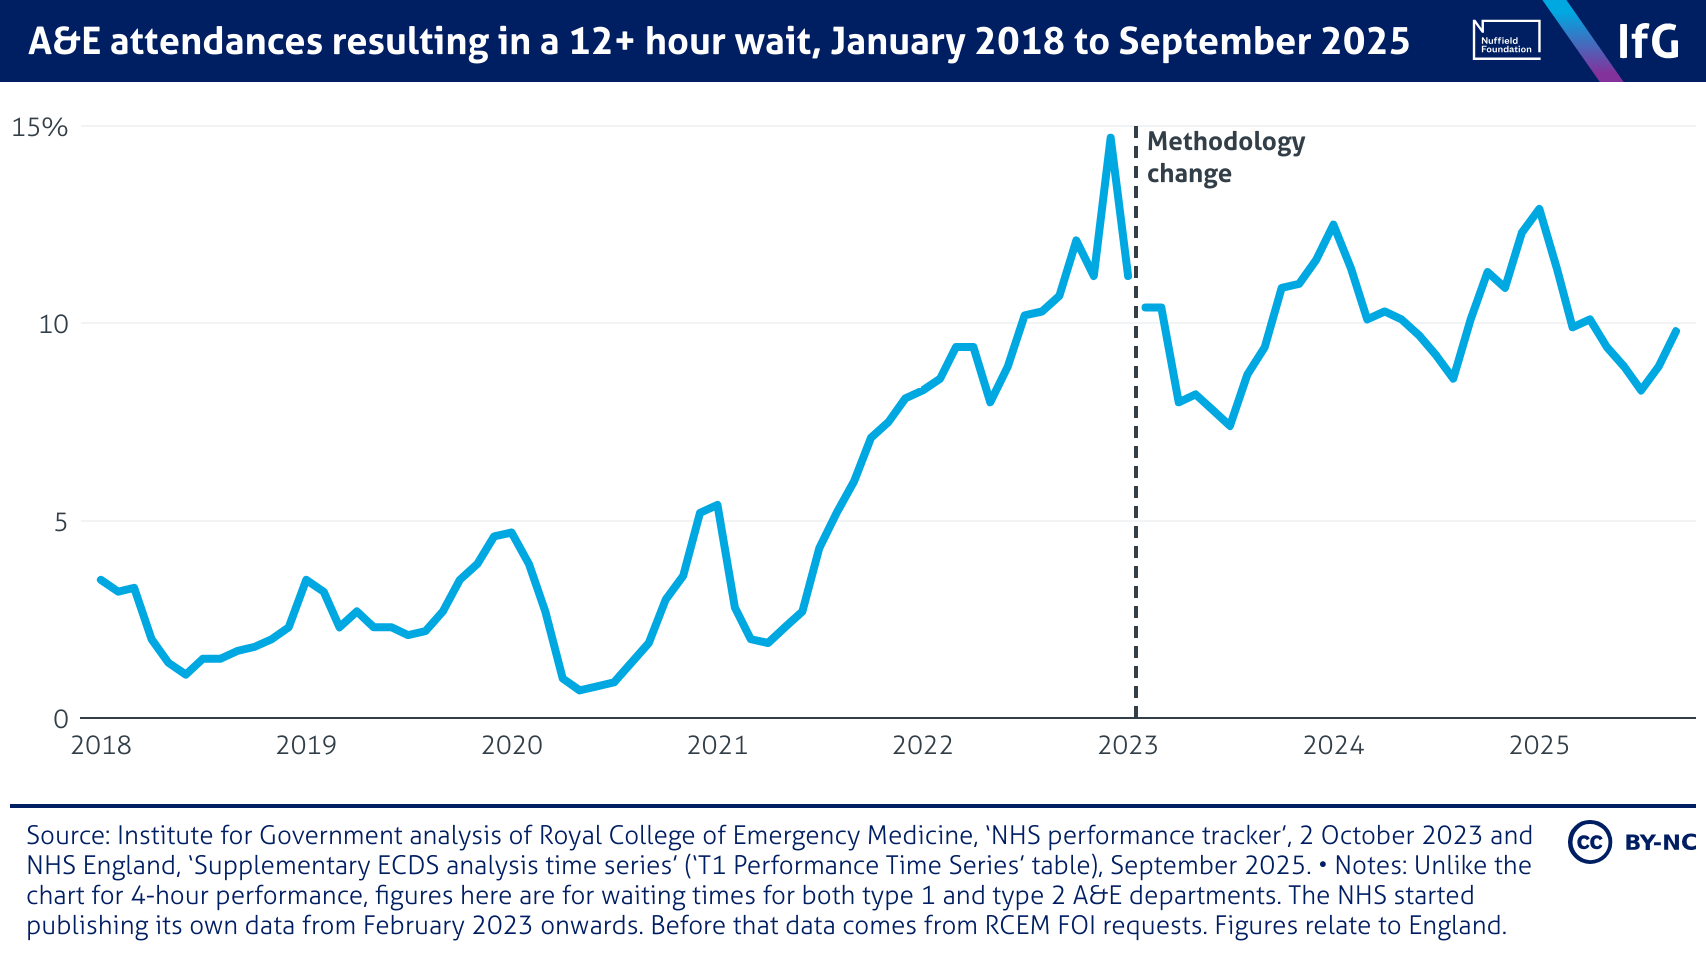
A&E attendances resulting in a 12+ hour wait, January 2018 to September 2025

A line chart from the Institute for Government showing A&E attendances resulting in a 12+ hour wait, January 2018 to September 2025. The share of patients waiting over 12 hours has risen sharply from under 1.1% in June 2018 to nearly 14.7% at the end of 2022, before a methodology change in early 2023. Since then, the rate has fluctuated between 7% and 13%, consistently peaking during colder months, and remaining far above pre-pandemic levels.

