The graduation gap, 2020-21
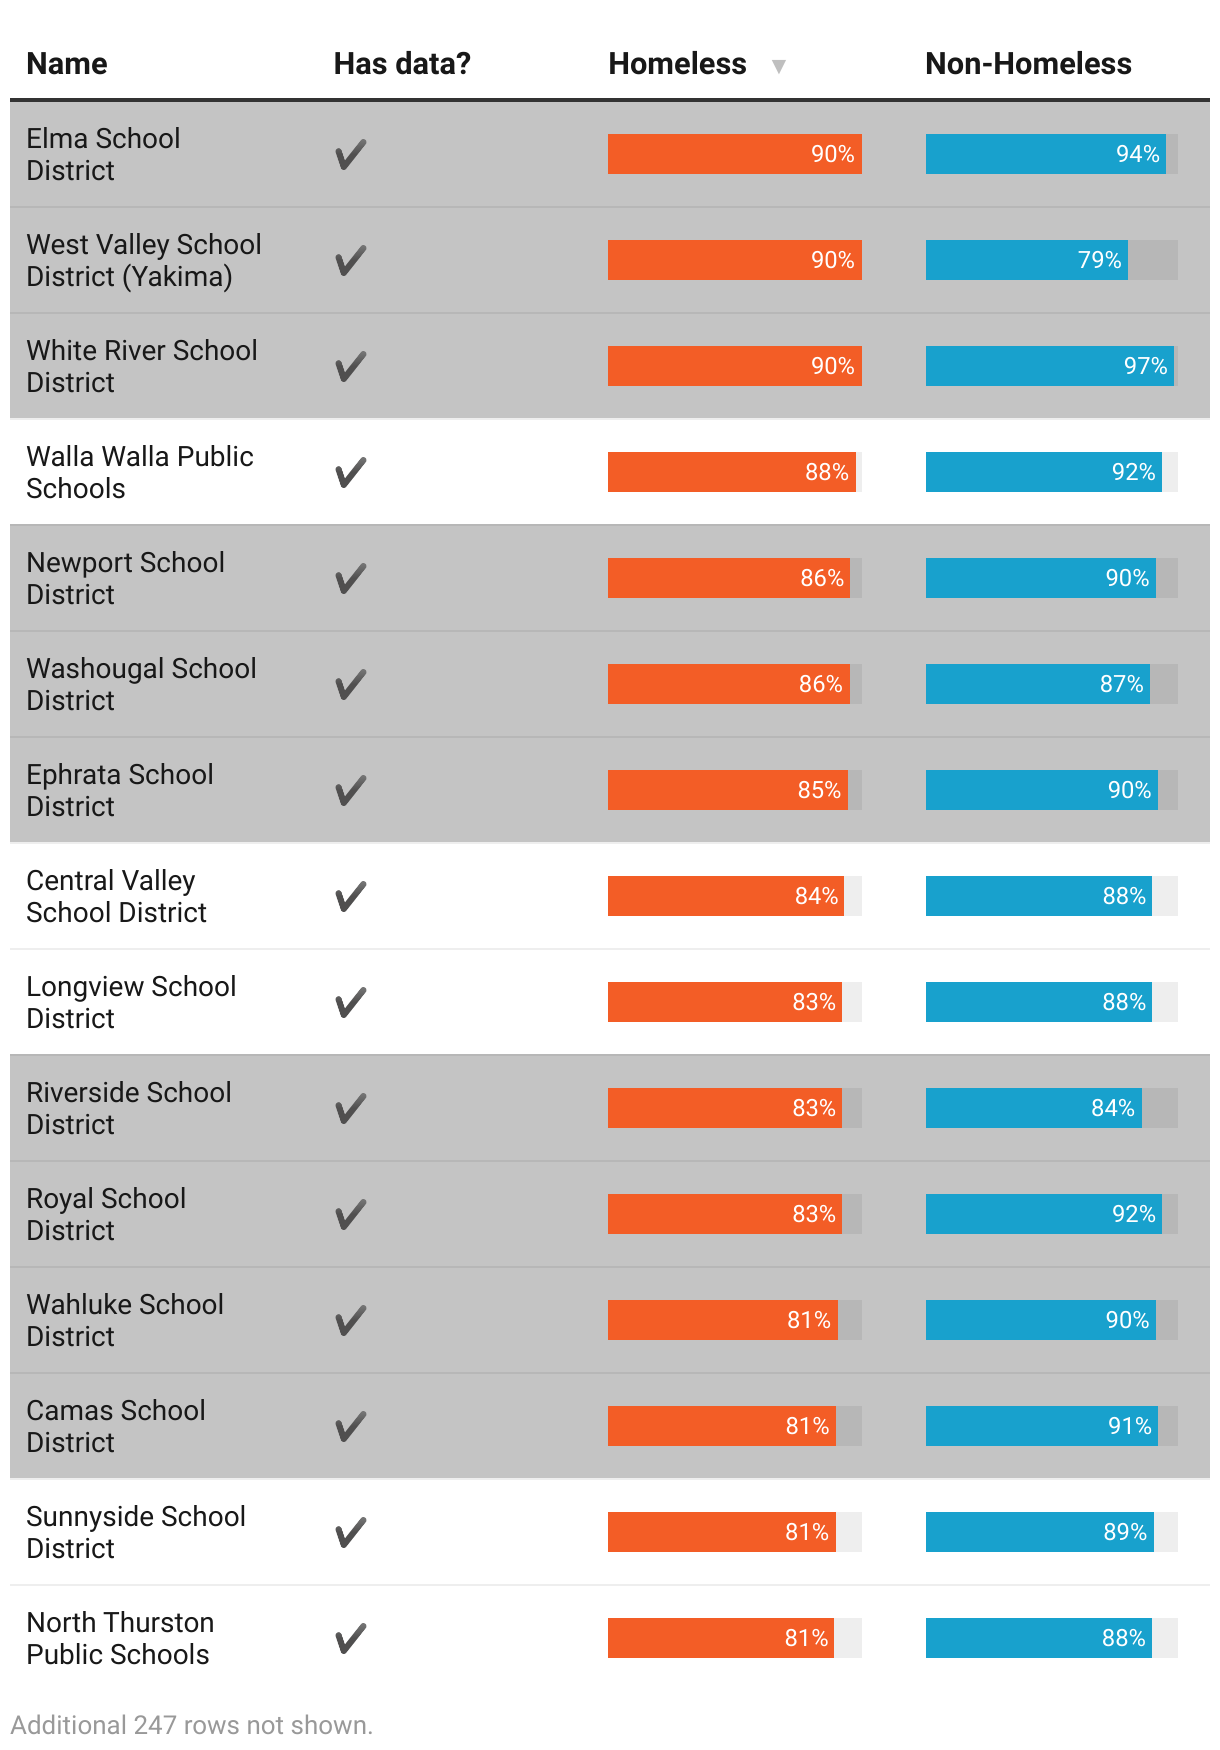
Filter or sort the table below to compare the four-year graduation rates among high school students who experienced homelessness and those who did not in Washington.
Tip: To drop rows where exact graduation rate data was not made public to protect student privacy or was otherwise unavailable, search for the check mark (✔️).
Districts with fewer than 30 homeless students in a four-year cohort are shaded gray as a reminder that slight changes in how many students graduate result in relatively large changes in the graduation rate.
Bar charts compare the graduation rates of homeless high school students to the rate among students who did not experience homelessness for each school district in Washington state. District names are shown on a gray background if fewer than 30 homeless students were in a graduating cohort. A green check mark appears besides the names of districts where data was available to compare the graduation rates for homeless and non-homeless students.