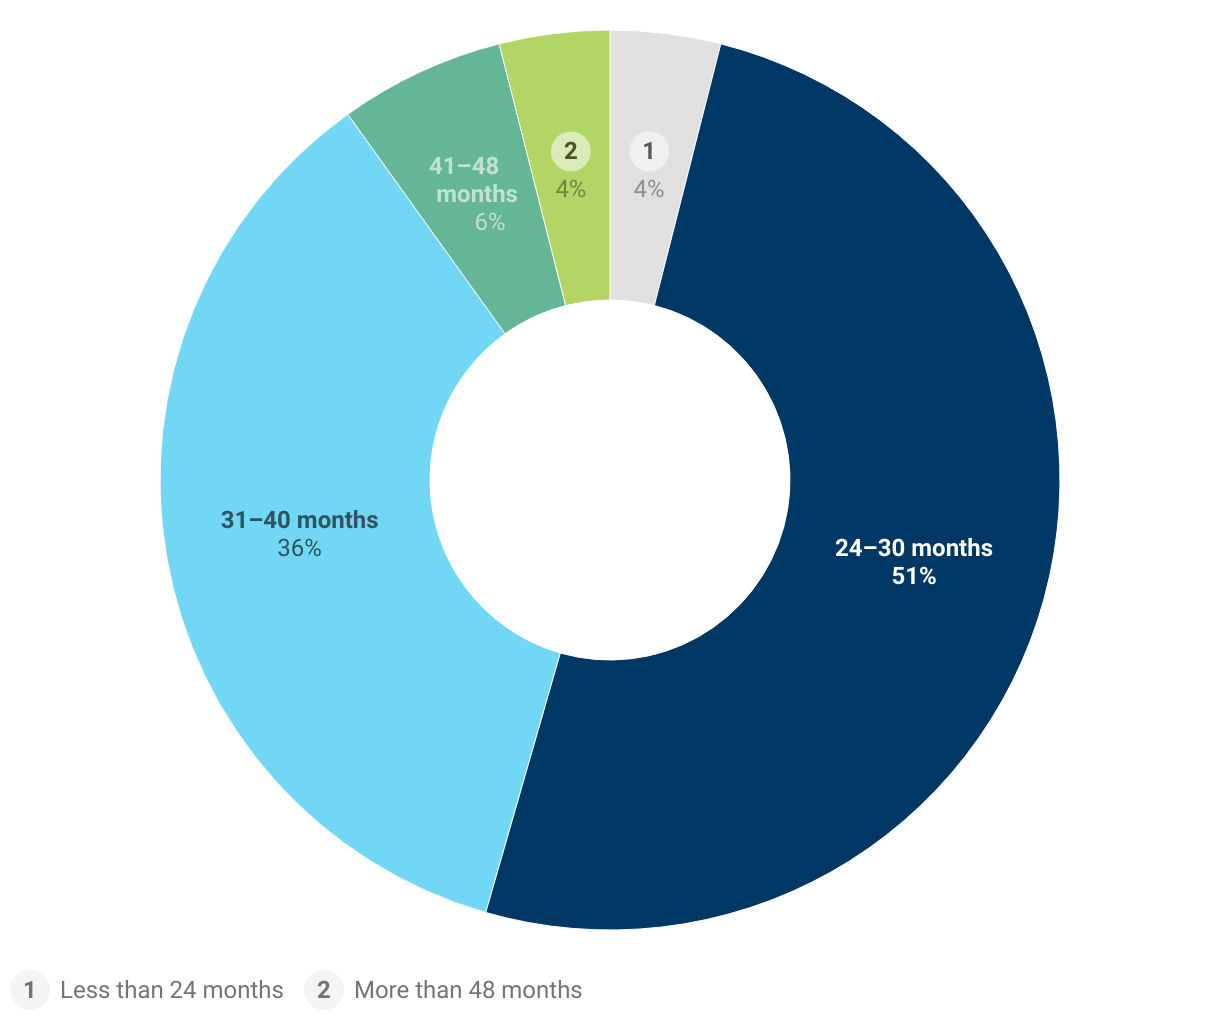
On average, how long is the product development and launch cycle for your powertrain technology?
Donut chart titled "On average, how long is the product development and launch cycle for your powertrain technology?" The chart has five slices. The first slice is light gray and reads "Less than 24 months, 4%." The second slice is dark blue and reads "24 to 30 months, 51%." The third slice is light blue and reads "31 to 40 months, 36%." The fourth slice is dark green and reads "41 to 48 months, 6%." The fifth slice is light green and reads "More than 48 months, 4%."