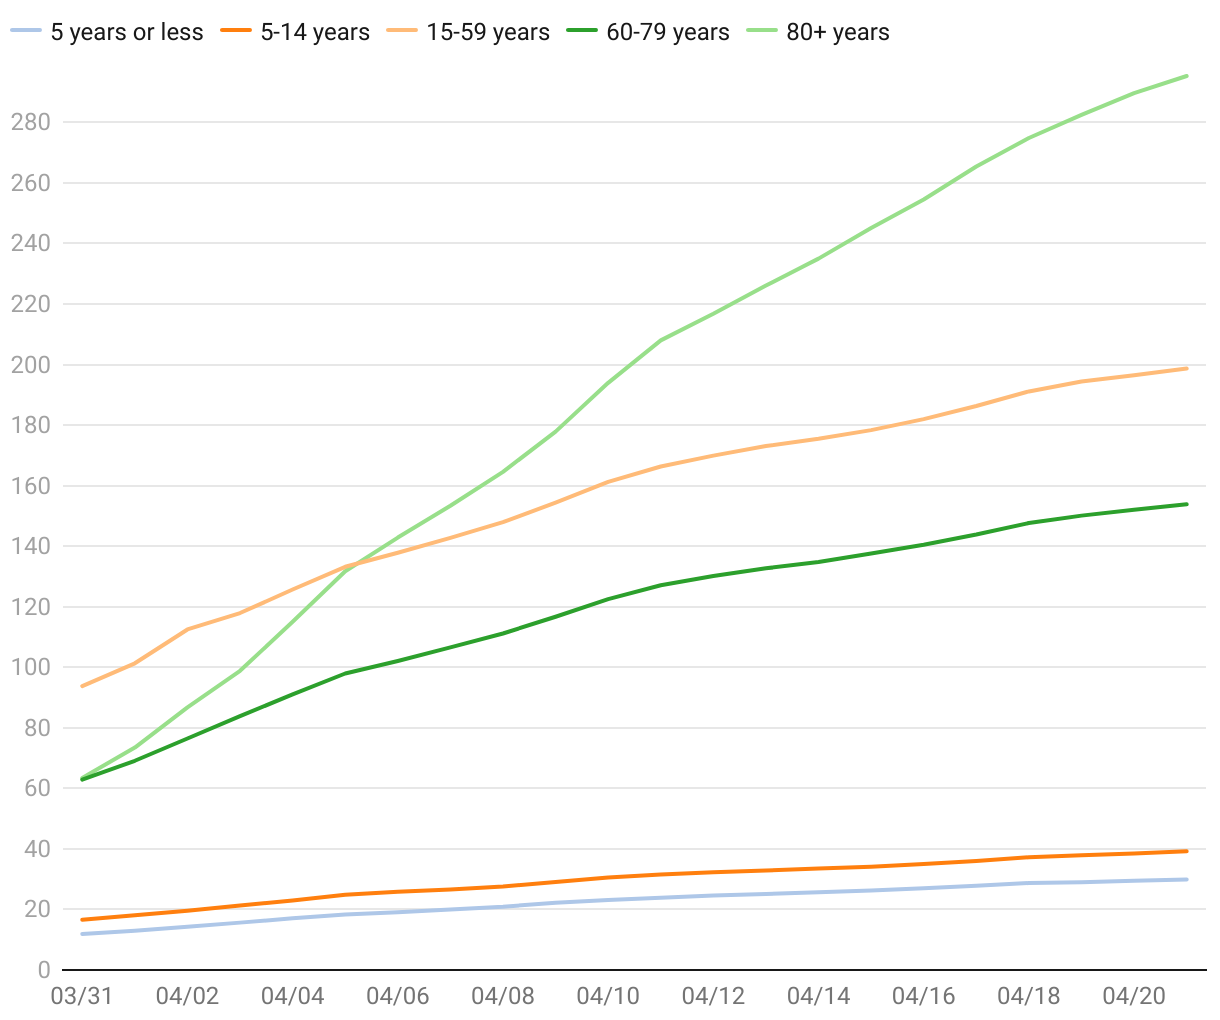
Figure 3: Total confirmed cases per 100,000 population by age group
(Please use a modern browser to see the interactive version of this visualization)