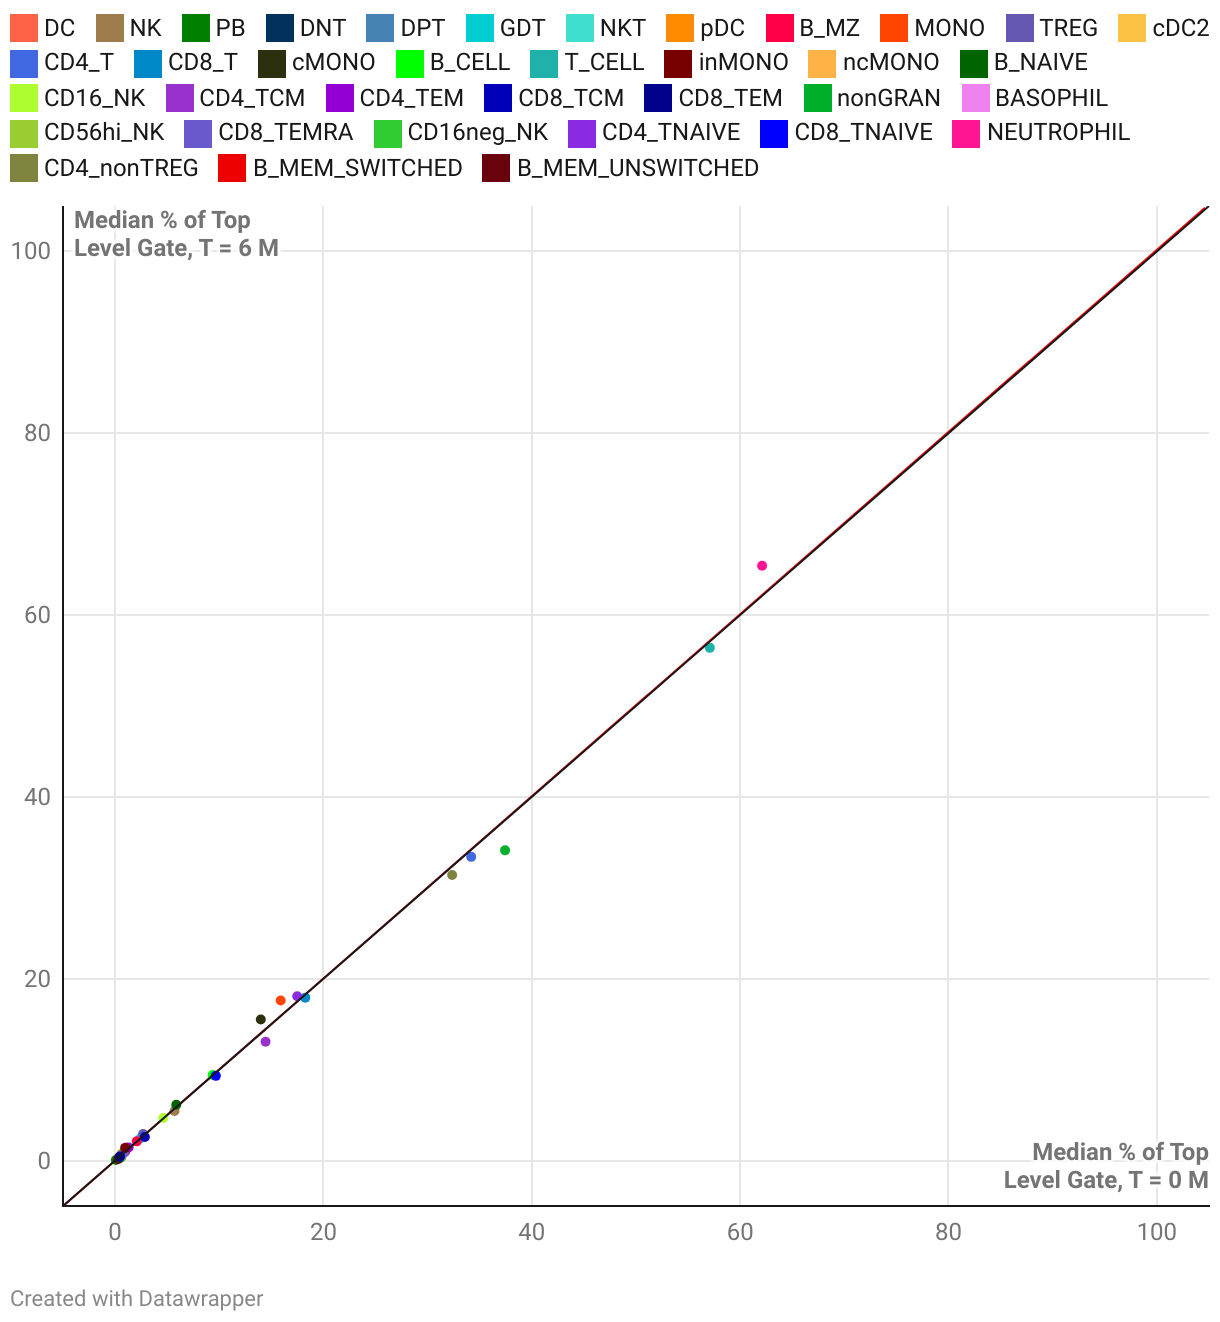
Population Frequencies: T = 6 M vs. T = 0 M
Data from the TokuKit stability study (n=3 donors), evaluated using a 25-marker spectral flow cytometry panel on fixed whole blood. For each cell population, the percent of its top-level gate was assessed at T = 0 and T = 6 months post-fixation. Each point represents the correlation between the median percent of parent across the three donors at the two time points.
R = 0.998
p = 6.08e-43
y = 1.002x - 0.017