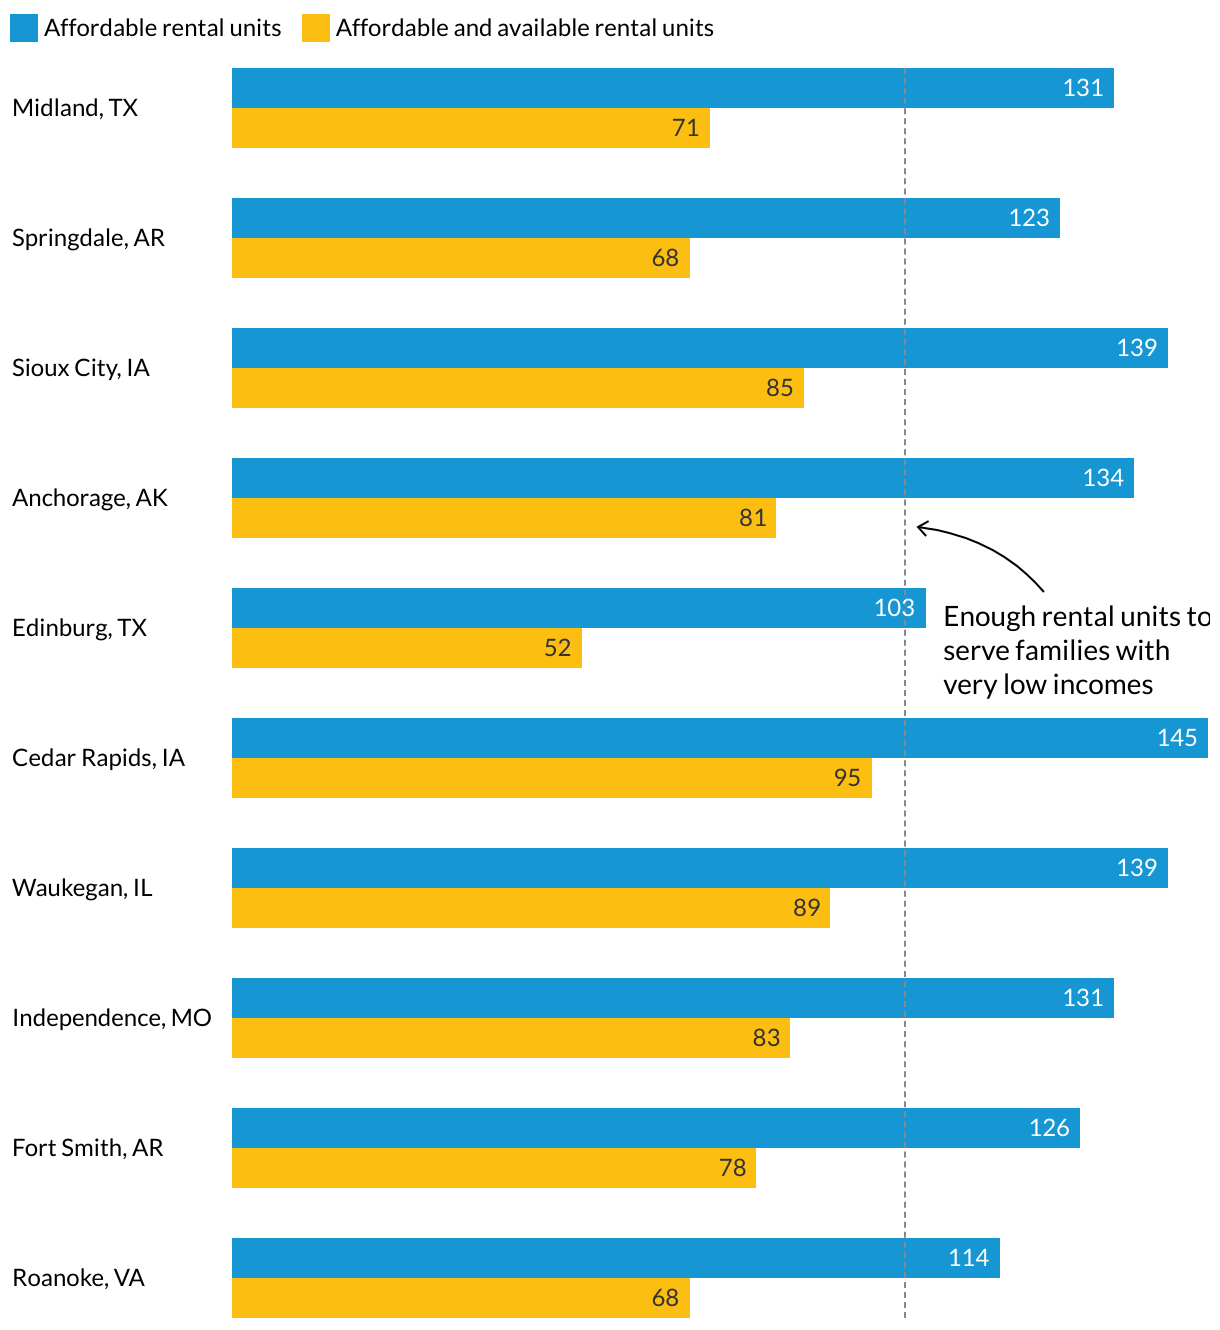
Horizontal bar chart that shows housing units per 100 households with very low incomes, by city. Though these cities have high shares of affordable rental housing, they have a smaller share of housing that is affordable and available.
(Please use a modern browser to see the interactive version of this visualization)