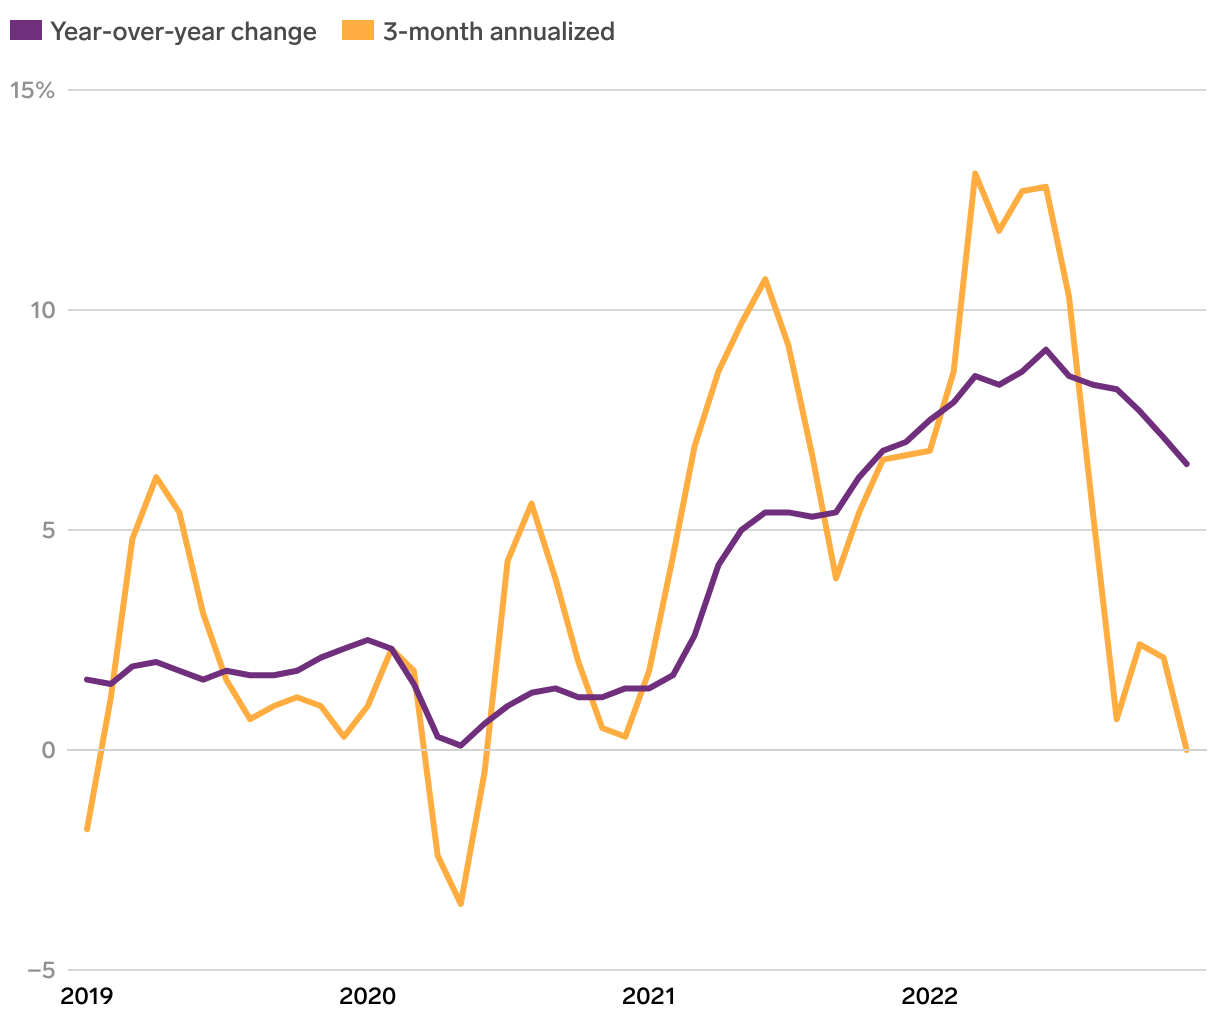
Changes in the Consumer Price Index
A line chart with two lines starting in January 2019. The blue line is showing the year-over-year percent change in the Consumer Price Index, and the green line is showing the annualized 3-month change in this index.