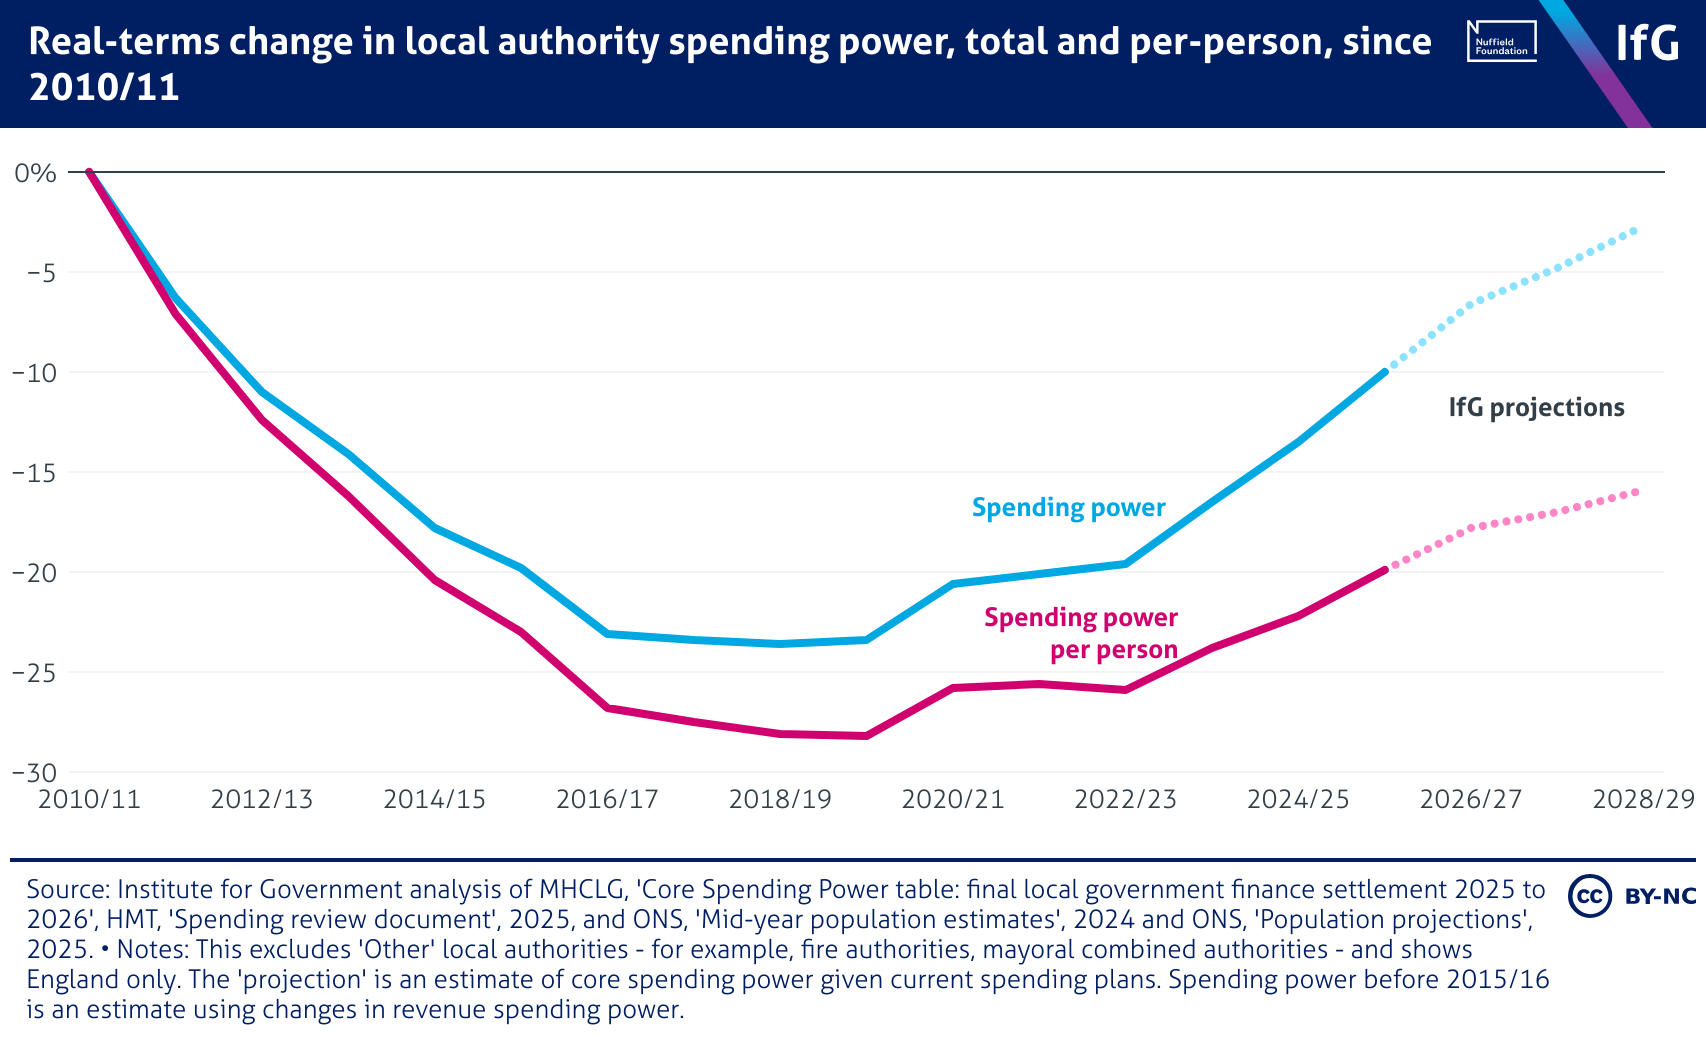
Real-terms change in local authority spending power, total and per-person, since 2010/11

A line chart from the Institute for Government of real-terms change in local authority spending power, total and per person, since 2010/11, where both measures fell steeply until 2018/19 before partially recovering, with projections showing spending power remaining below 2010/11 levels until 2028/29.