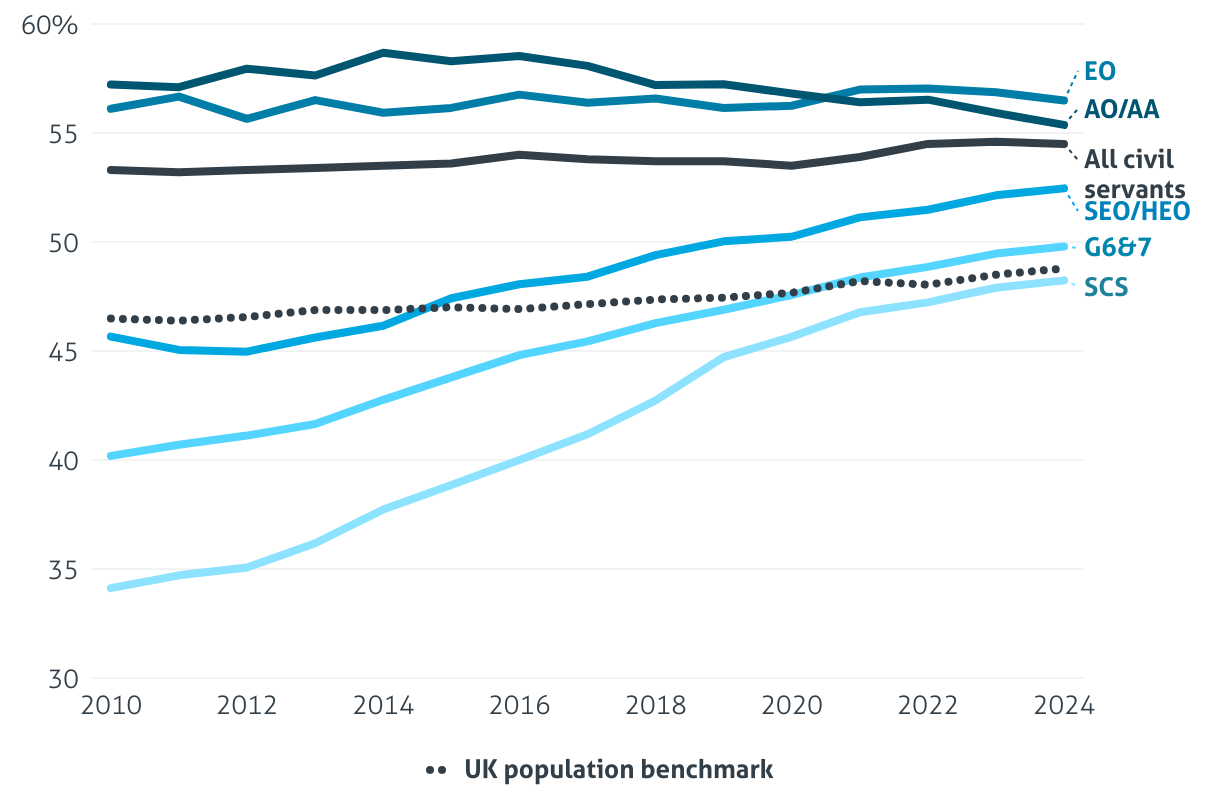
Female civil servants by grade, 2010–24
A line chart from the Institute for Government showing female staff in the civil service by grade, 2010-24. By 2021 the share of women staff at all grades except the senior civil service exceeds the UK population benchmark.
