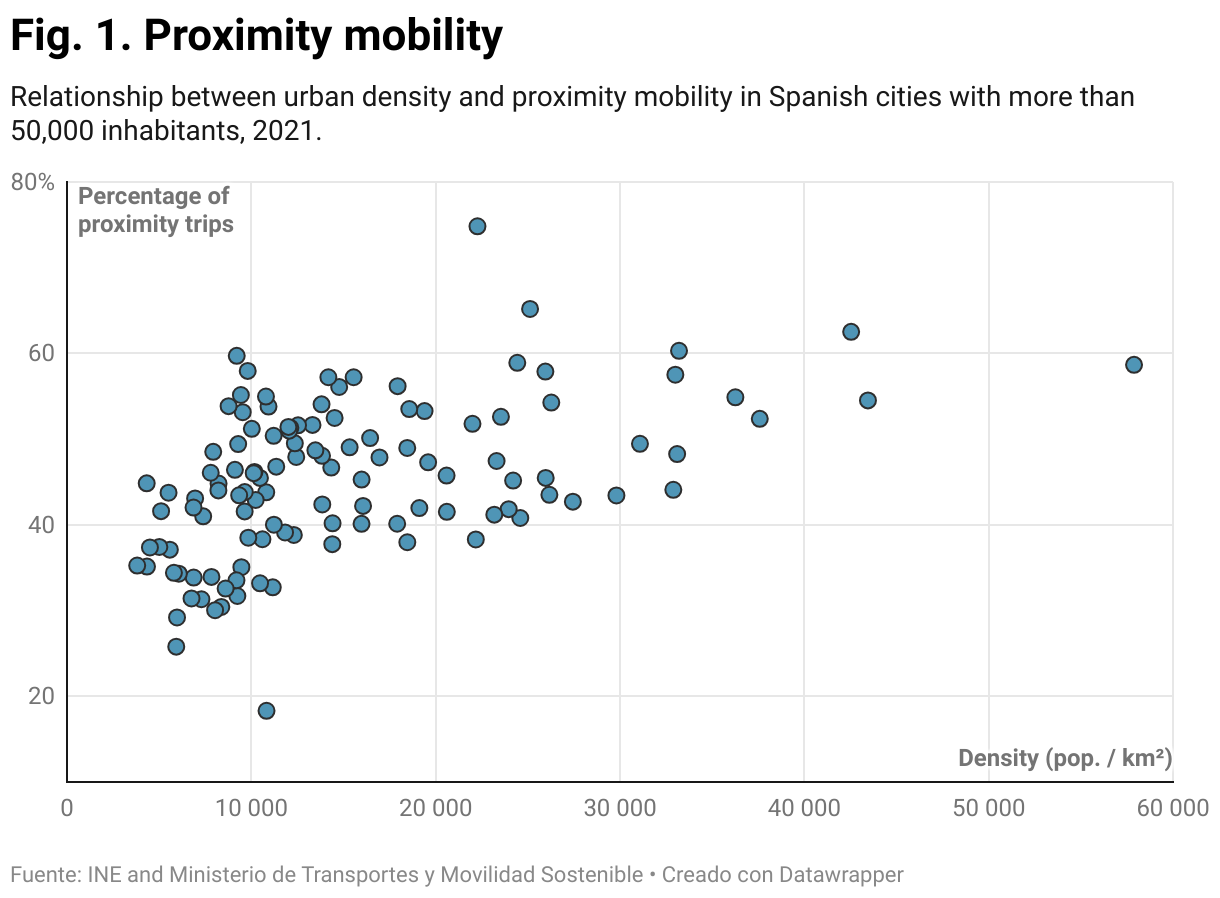
Fig. 1. Proximity mobility
Relationship between urban density and proximity mobility in Spanish cities with more than 50,000 inhabitants, 2021.
This scatter plot shows the relationship between residential density (horizontal axis) and the percentage of proximity trips (vertical axis).
