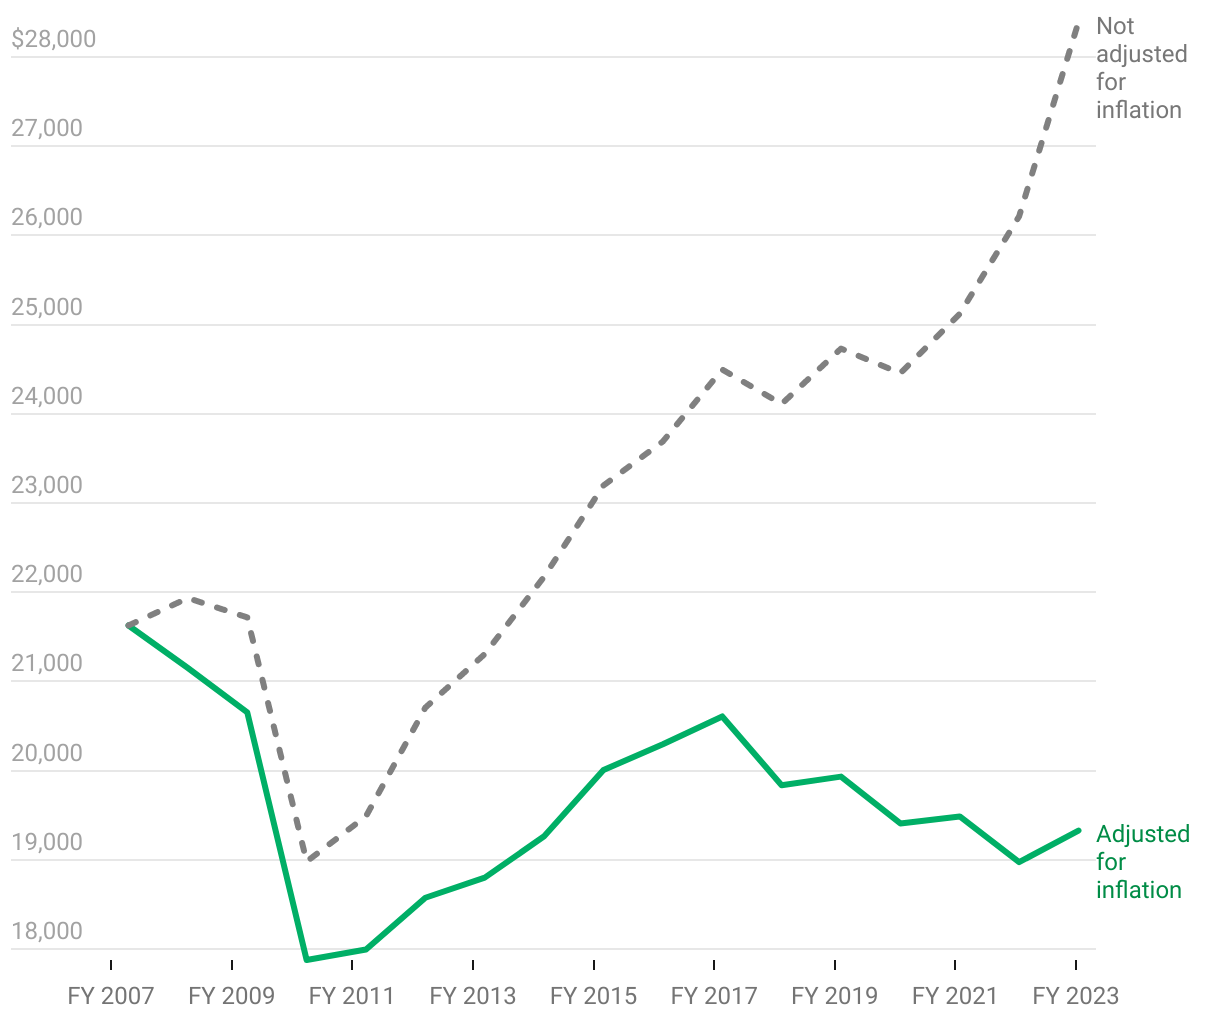
Ohio spends less than it did 15 years ago
State spending in the GRF, LGF, PLF and LPEF* by fiscal year, adjusted for inflation (in millions)
Line graph showing two lines: One represents Ohio's spending as it changed over time, adjusting for inflation. In 2023, it is lower than it was in 2007. The other represents the same spending bit does not adjust for inflation. It trends upward.