Multi-Agent Cost Reality
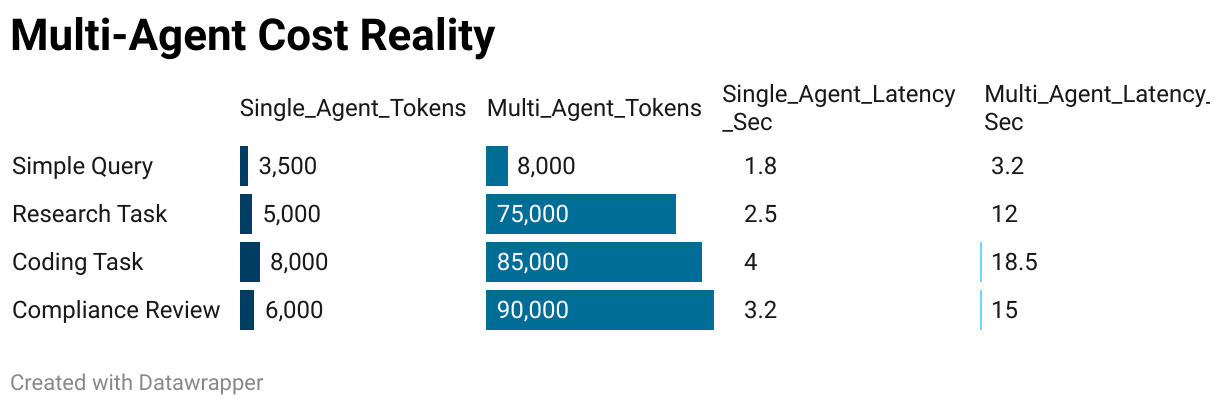
Bar chart comparing tokens used and response latency between single-agent and multi-agent approaches across different task types
(Please use a modern browser to see the interactive version of this visualization)
