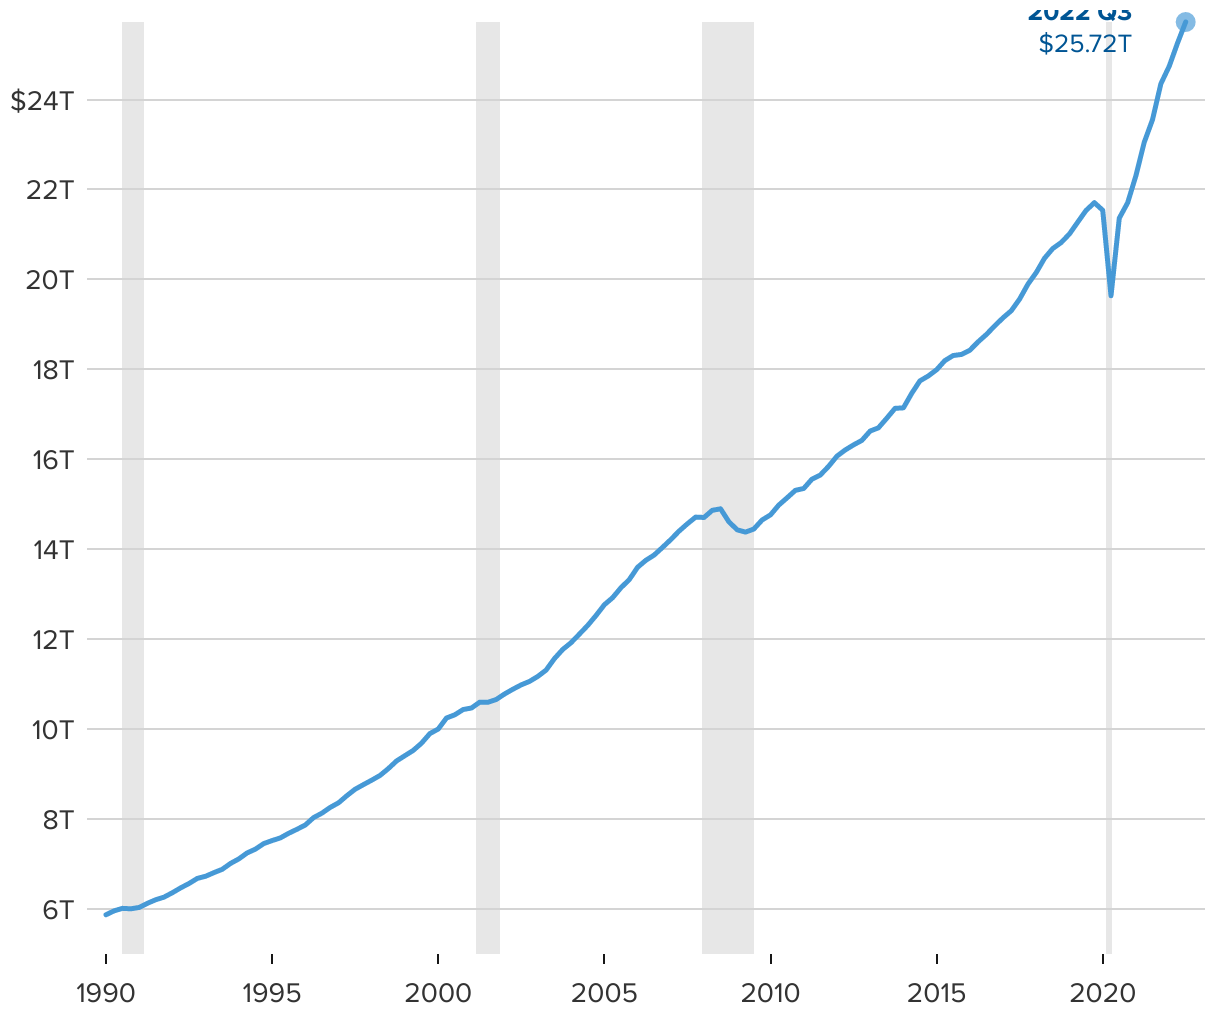
U.S. gross domestic product
The line chart shows U.S. gross domestic product, by quarter, from Q1 1990 through Q3 2022.
(Please use a modern browser to see the interactive version of this visualization)