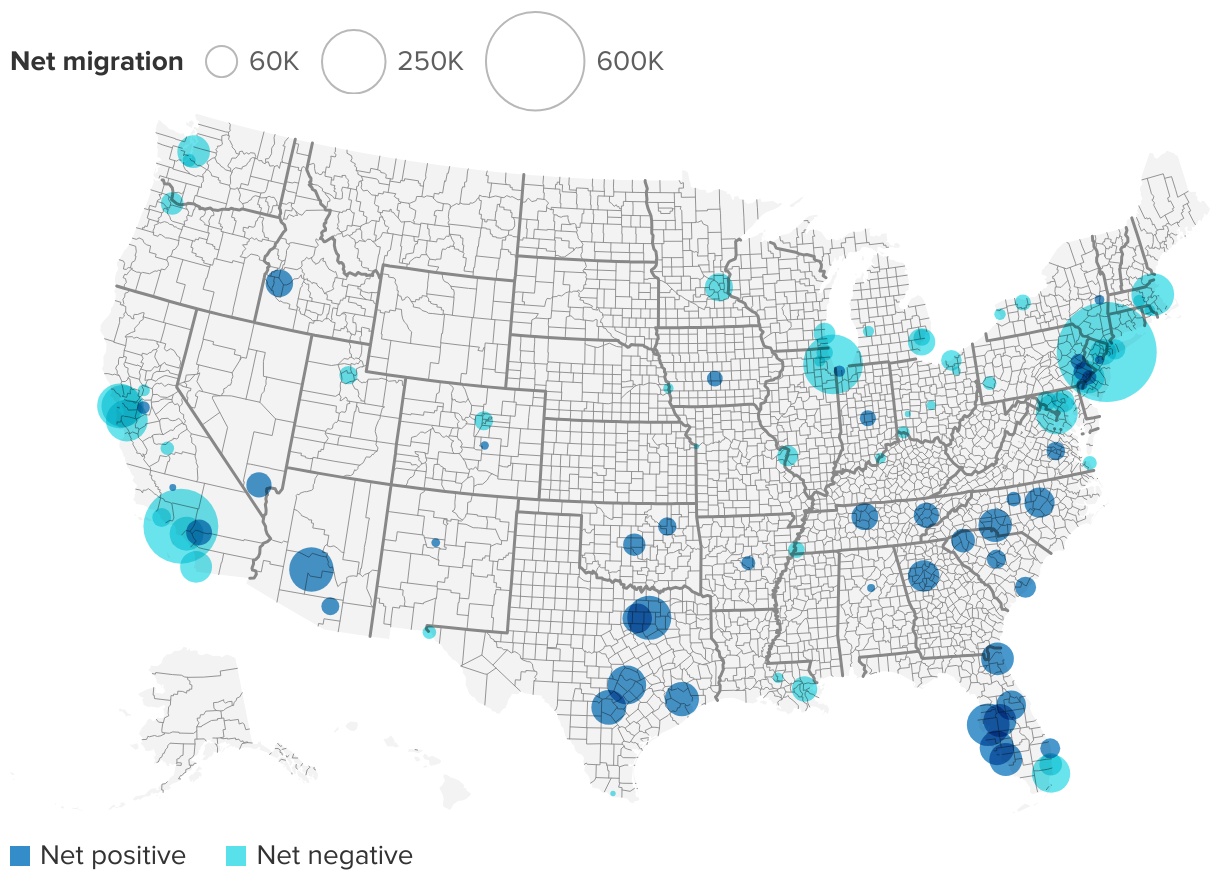
Migration patterns in the 100 biggest U.S. metros
Net positive and net negative migration between 2021 and 2022
The map of the U.S. shows the net positive and net negative migration from the largest 100 metros between 2021 and 2022.
Net positive and net negative migration between 2021 and 2022