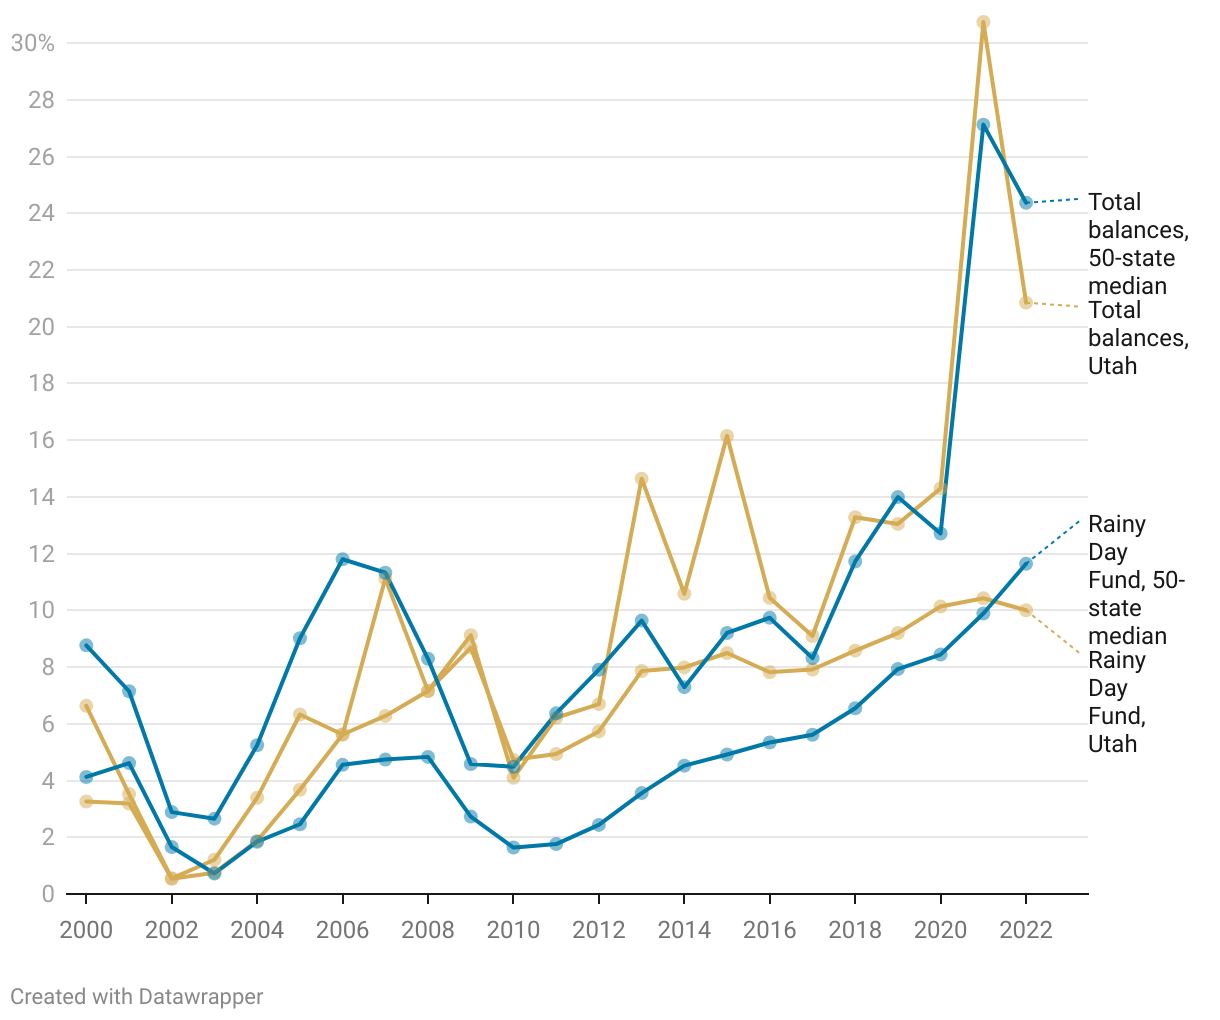
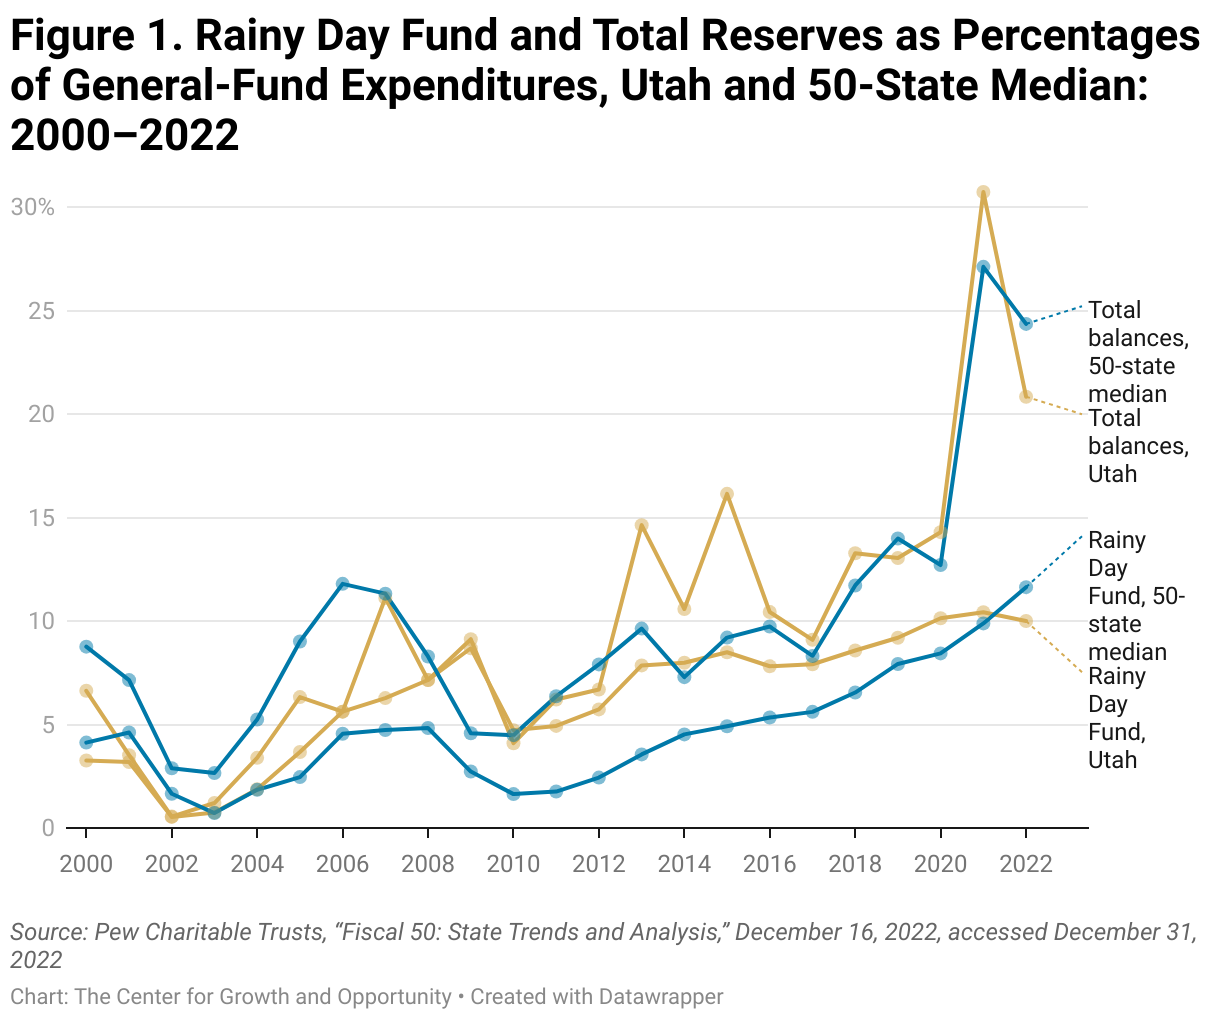
Figure 1. Rainy Day Fund and Total Reserves as Percentages of General-Fund Expenditures, Utah and 50-State Median: 2000–2022
(Please use a modern browser to see the interactive version of this visualization)