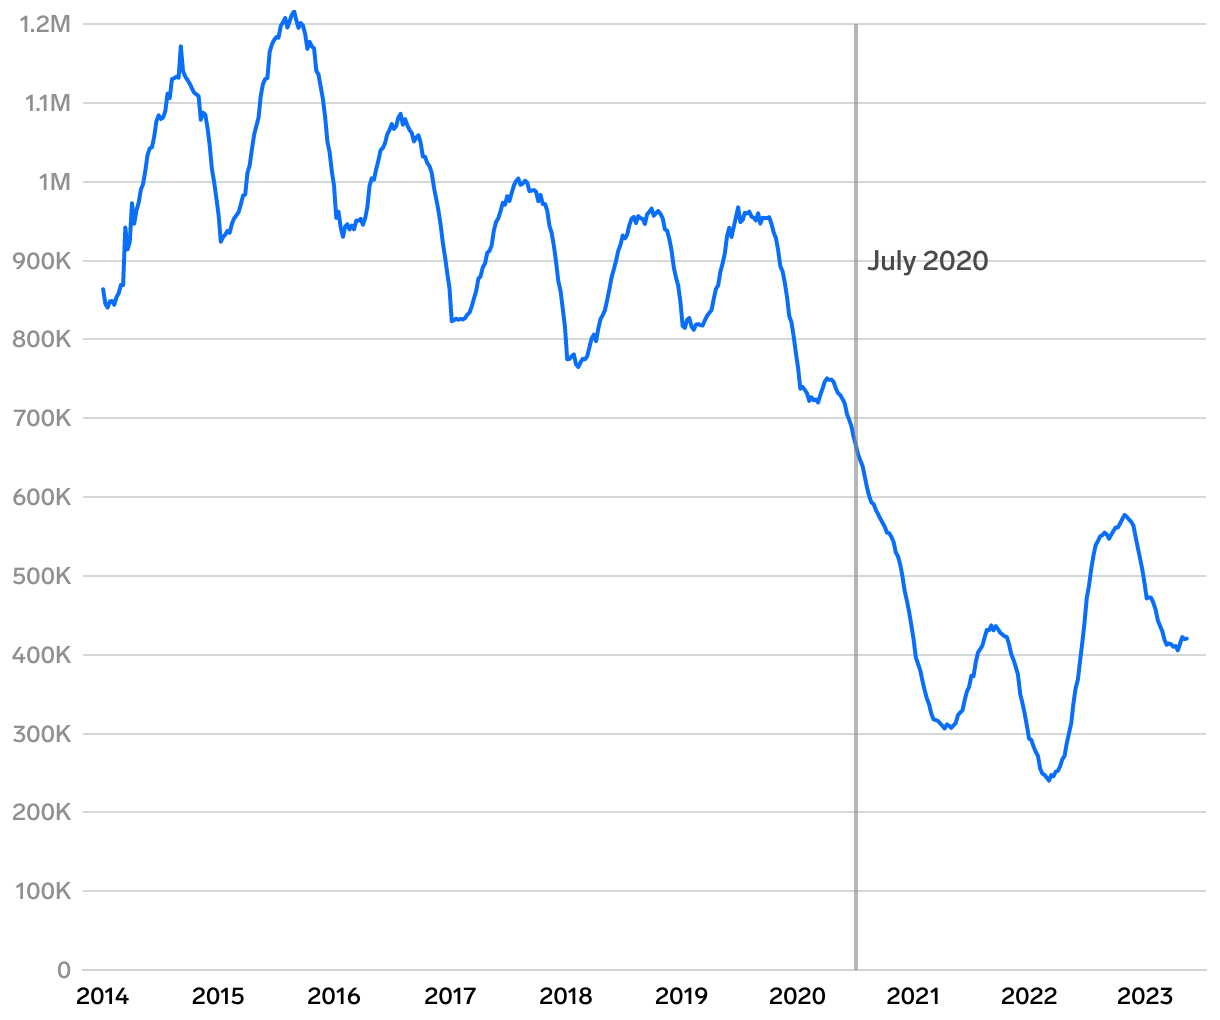
The number of homes actively for sale
A line chart depicting the decline of active for-sale inventory over time, with a dramatic fall occurring after April 2020.
(Please use a modern browser to see the interactive version of this visualization)