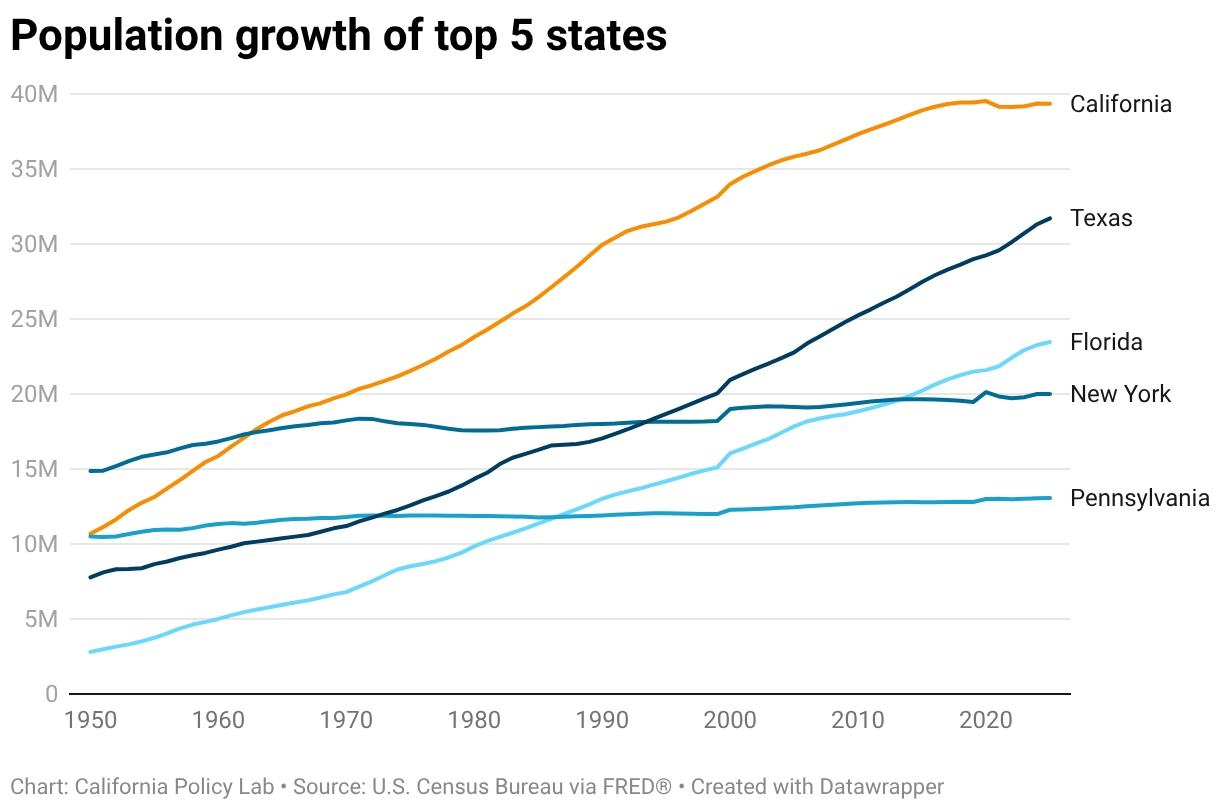
Population growth of top 5 states
A line graph comparing the population growth of California, Texas, Florida, New York, and Pennsylvania from 1950 to 2025. California (orange) shows the most dramatic growth, rising from ~10 million in 1950 to nearly 40 million by 2020 before leveling off and slightly declining. Texas and Florida show steady, rapid growth, with Florida surpassing New York’s population around 2014. New York and Pennsylvania show much slower, flatter growth trends.
