Cities With "Adverse Benchmark" FHRs>10.2 per 100k
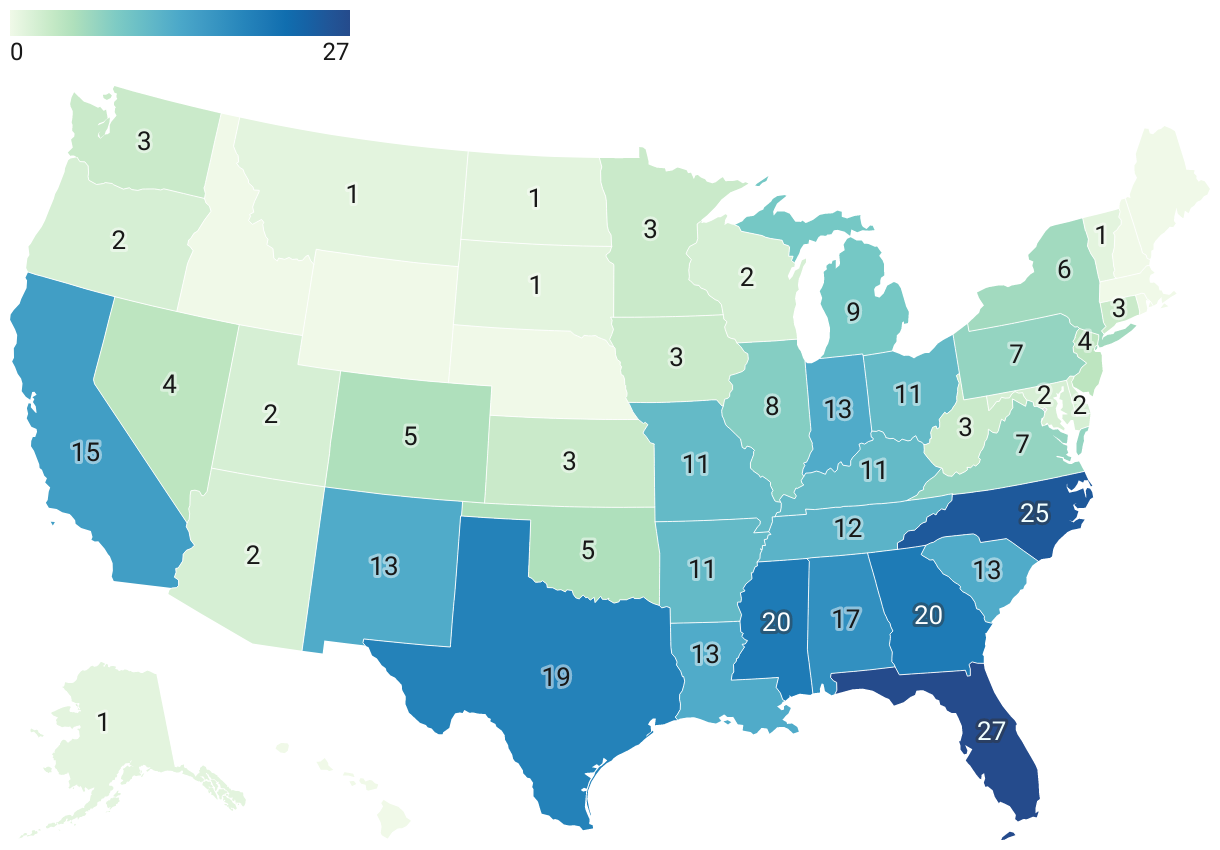
This visualization depicts the absolute number of cities within each US state that meet or exceed the adverse Firearm Homicide Rate benchmark of 10.2 per 100,000. It shows that most states contain several or more cities with elevated firearm violence and that these states are geographically and politically diverse.
This visualization depicts the absolute number of cities within each US state that meet or exceed the adverse Firearm Homicide Rate benchmark of 10.2 per 100,000. It shows that most states contain several or more cities with elevated firearm violence and that these states are geographically and politically diverse.