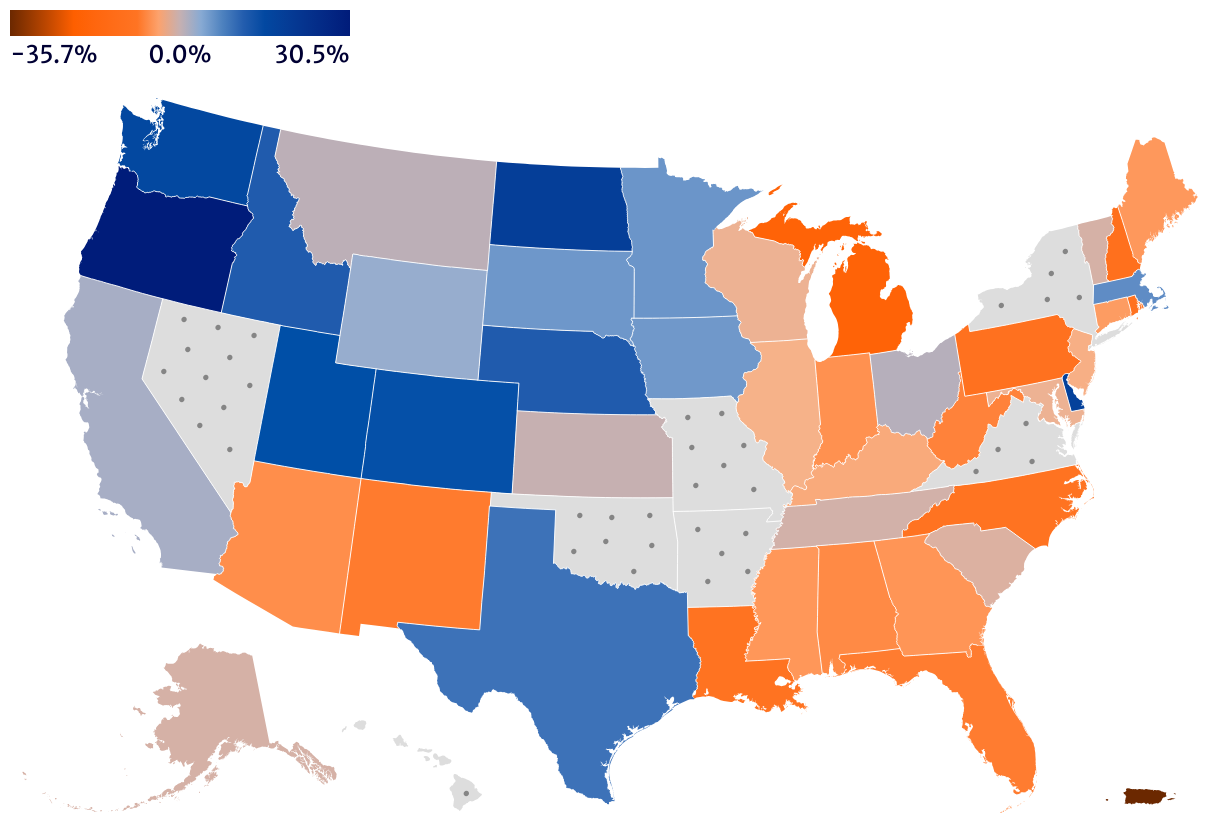
Great Recession's Scars Lingered on Public Education in Some States
Percent Change in Employment in Local Government Education, 2008–2019
This figure, Figure 7, shows the percent change in local government education between 2008 and 2019 by state and territory. It includes information for the 50 US states, the District of Columbia, and Puerto Rico. States and territories that experienced an increase in the number of local government education employees are shown in shades of blue, with darker shades indicating a higher percent change. States and territories that experienced a decrease in their local government education workforces are shown in shades of orange, with darker orange indicating a greater percent decline. States with missing data are shown in gray with dots; these include Arkansas, District of Columbia, Hawaii, Missouri, Nevada, New York, Oklahoma, and Virginia. There are 18 blue shaded states that represent zero or positive growth, while there are 26 orange shaded states plus Puerto Rico that contracted. Calculations for Puerto Rico are based on 'state' government data. Employment changes in the local education subsector ranged from a 30.5 percent increase in Oregon to a 35.7 percent decrease in Puerto Rico.
Source: Authors' analysis of State and Area Employment, Hours, and Earnings data, US Bureau of Labor Statistics, 2008–2019.