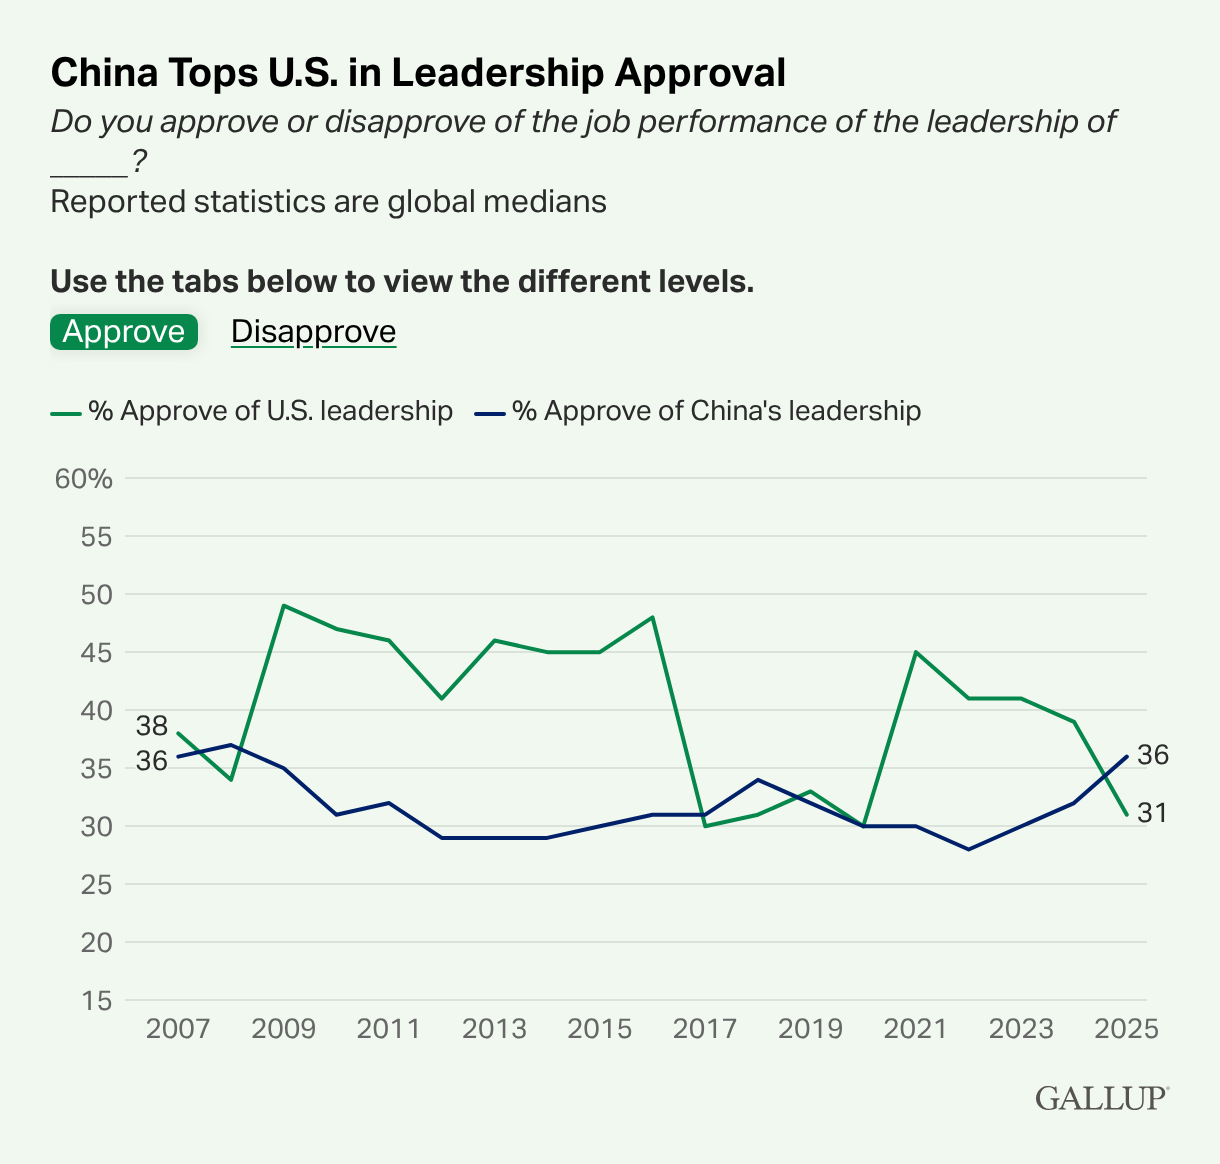
China Tops U.S. in Leadership Approval
Do you approve or disapprove of the job performance of the leadership of _____?
Reported statistics are global medians
Use the tabs below to view the different levels.
Approve
Disapprove
Line chart titled “China Tops U.S. in Leadership Approval” shows global median approval for the two nations from 2007 to 2025. The United States starts at 38% in 2007, peaks at 49% in 2009, then declines sharply to 30% in 2017, recovers to 45% in 2021, and ends at 31% in 2025. China begins at 36%, dips to 29% in 2012–2014, rises gradually, and reaches 36% in 2025. The lines cross several times, with gaps between the U.S. and China as large as 17 points from 2009-2016 and in 2021, but China surpasses the United States at the end. The pattern highlights volatility in U.S. approval and steadier, modest gains for China since 2014.
