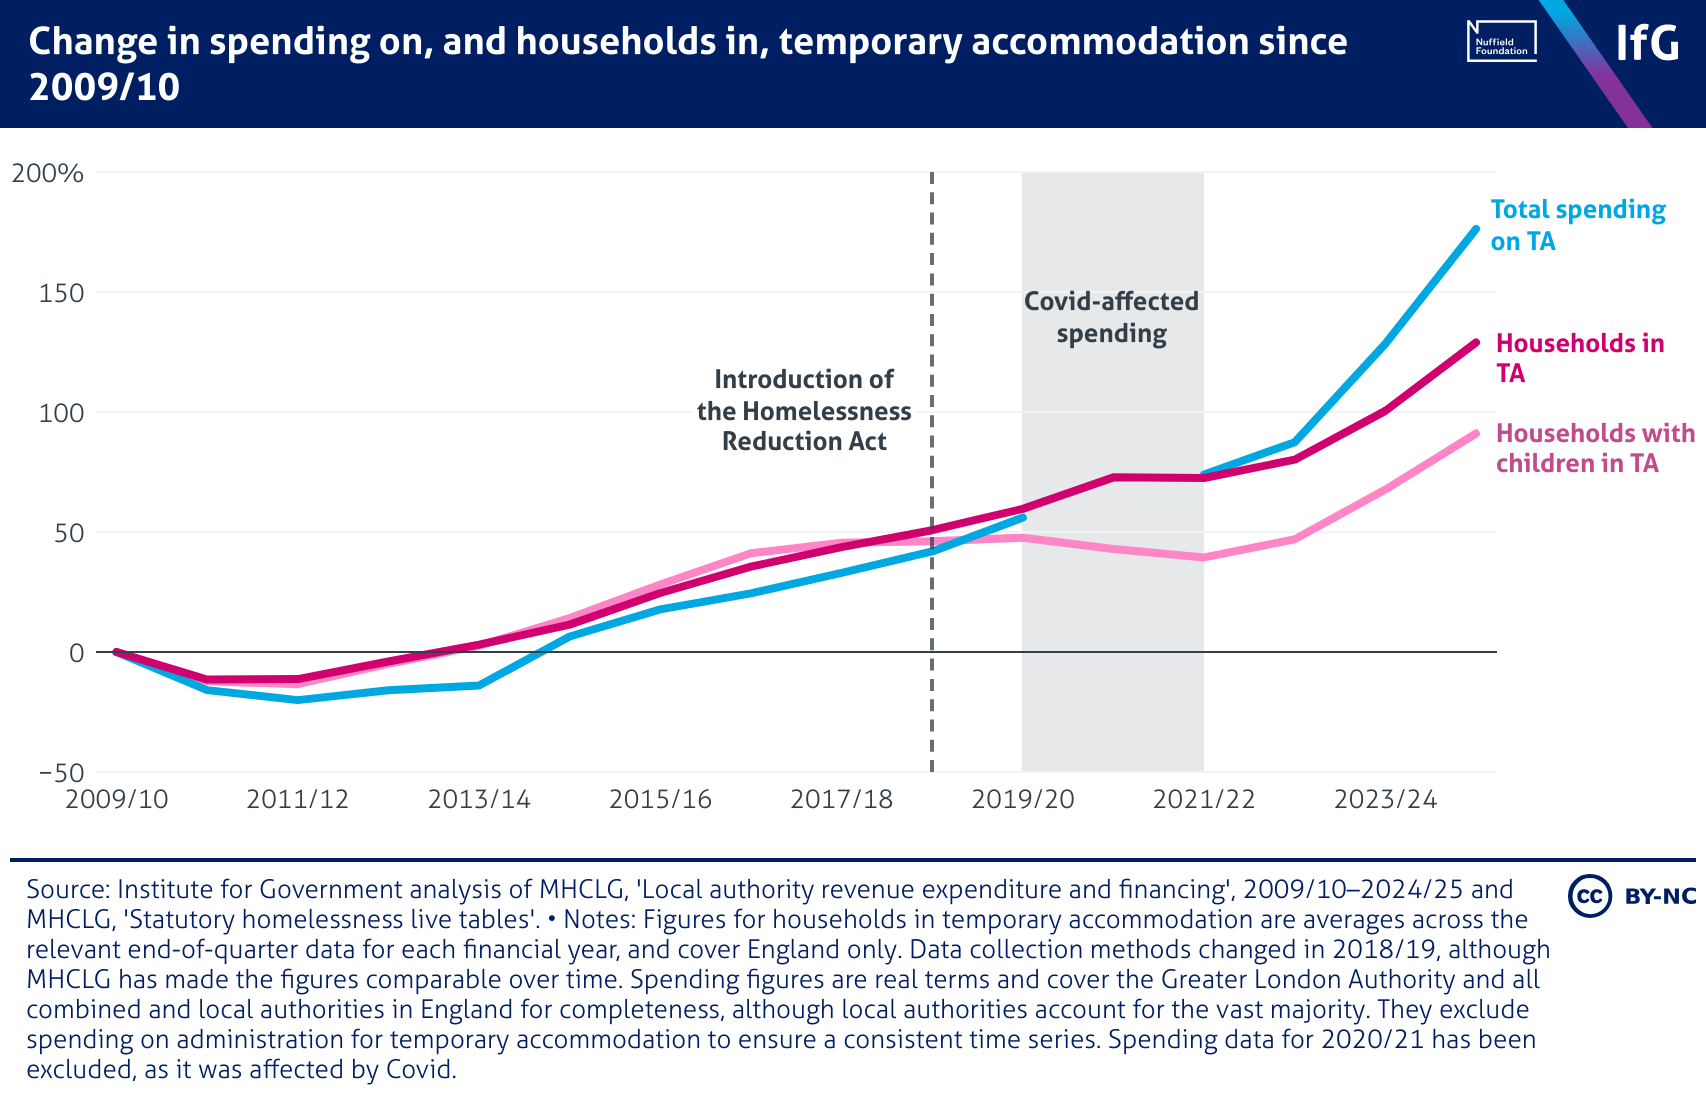
Change in spending on, and households in, temporary accommodation since 2009/10

A line chart of change in spending on, and households in, temporary accommodation since 2009/10 where total spending on TA has grown at a faster rate than the number of households in temporary accommodation and the number of households in temporary accommodation since around 2021/22.

