Frequency of extreme humidity events
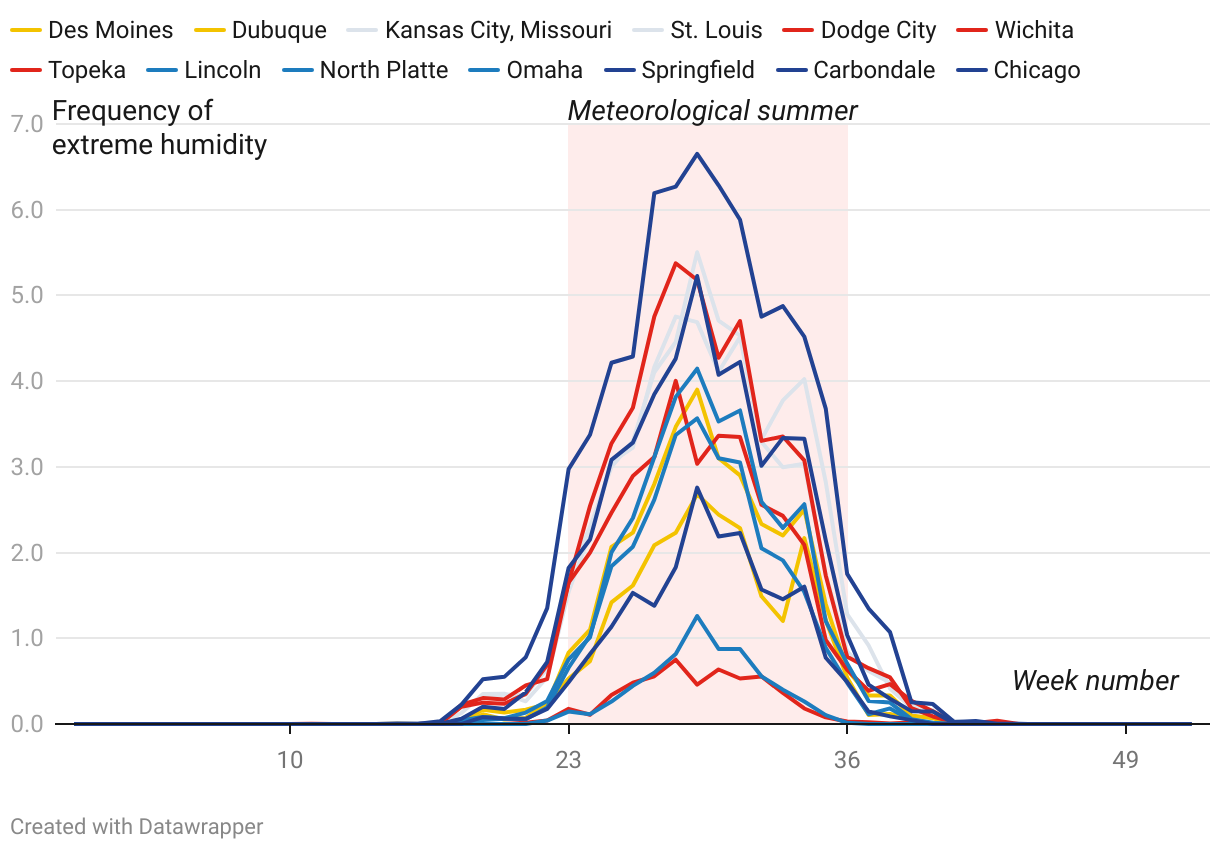
The chart below shows the relative frequency of hourly readings of dew points of 70 degrees or higher during the past 30 years at each location. Data aggregated by standardized week.
The chart below shows the relative frequency of hourly readings of dew points of 70 degrees or higher during the past 30 years at each location. Data aggregated by standardized week.