Change in civil servant numbers by grade, 2010–24
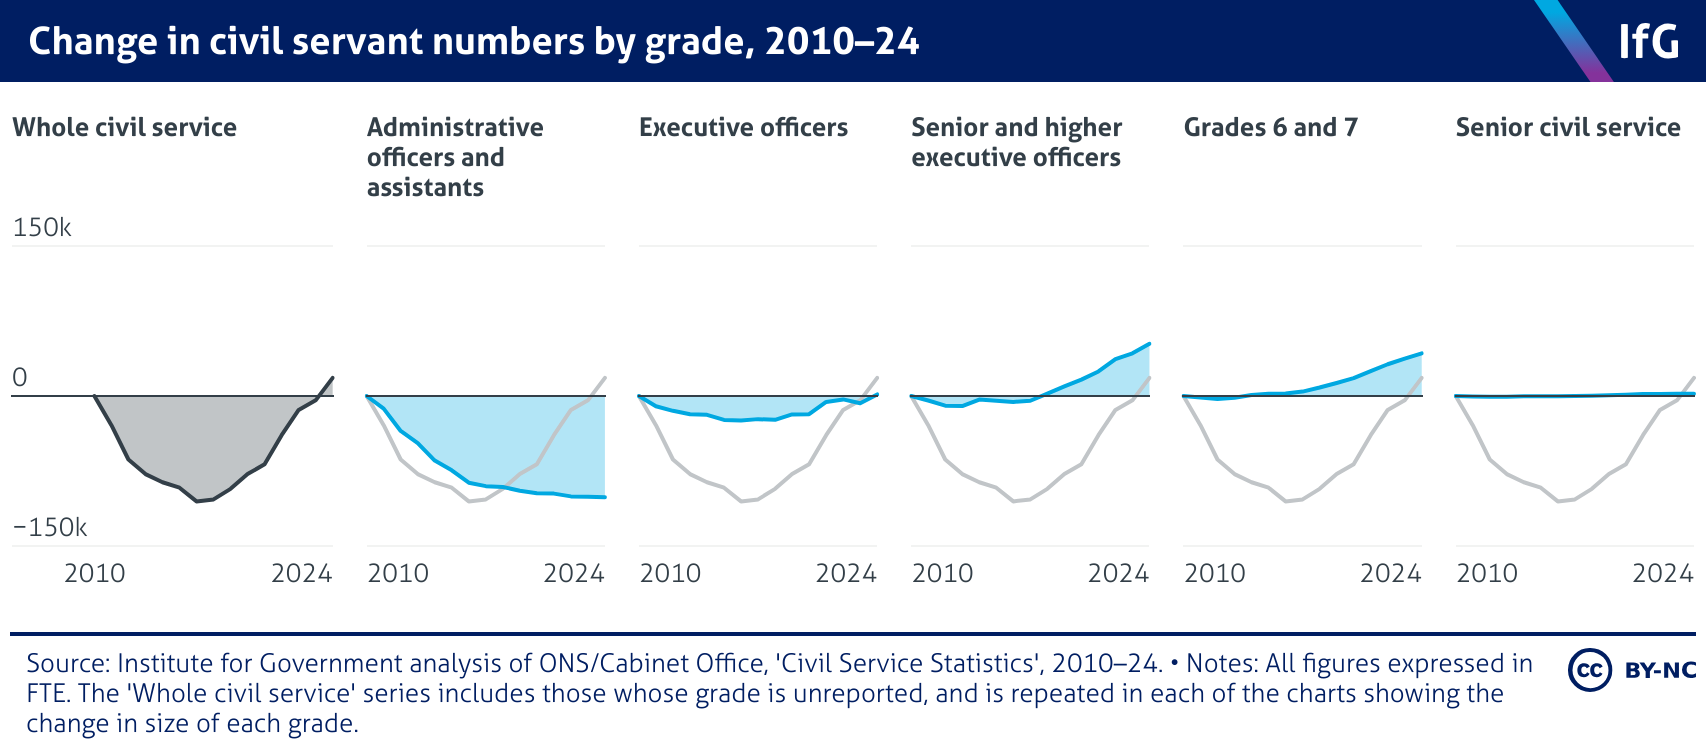
A series of six line charts from the Institute for Government, each showing the change in the number of civil servants at each grade since 2010. The most junior grades decreased steeply after 2010 and have not risen again. More senior grades fell by far less after 2010, and began expanding rapidly after 2016. There are now far more of these mid-level and more senior grades than there were in 2010. The first line chart shows the civil service overall, which declined in size until 2016, then began growing again, and has now surpassed its size in 2010.

