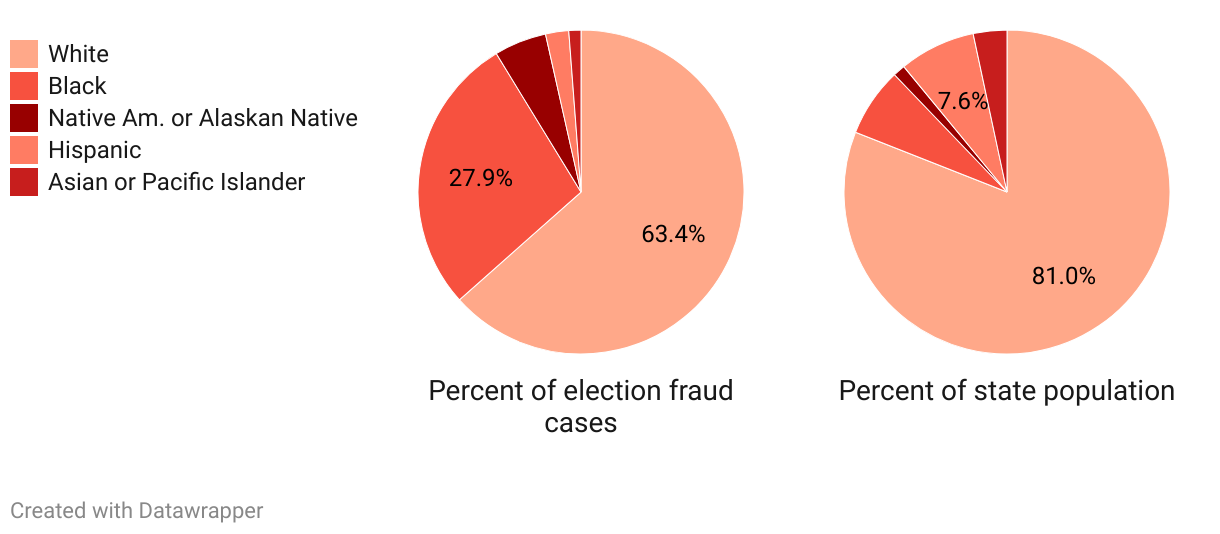
Racial disparity in those charged with election fraud
Black Wisconsinites make up less than 7% of the state's population, but from 2012-2022 were defendants in 27.9% of election fraud cases, largely driven by Milwaukee County prosecutions.
A graphic titled "Racial disparity in those charged with election fraud" has two pie charts side by side. The left pie chart shows the percent of election fraud by race, and the right shows the percent of the state population by race. The charts show that Black voters are overrepresented in the prosecutions, accounting for 27.9 percent of everyone charged but just 6.8 percent of the state's residents. Native American or Alaskan Native people are also overrepresented in the prosecutions, accounting for 5.2 percent of everyone charged but just 1.2 percent of the state population.