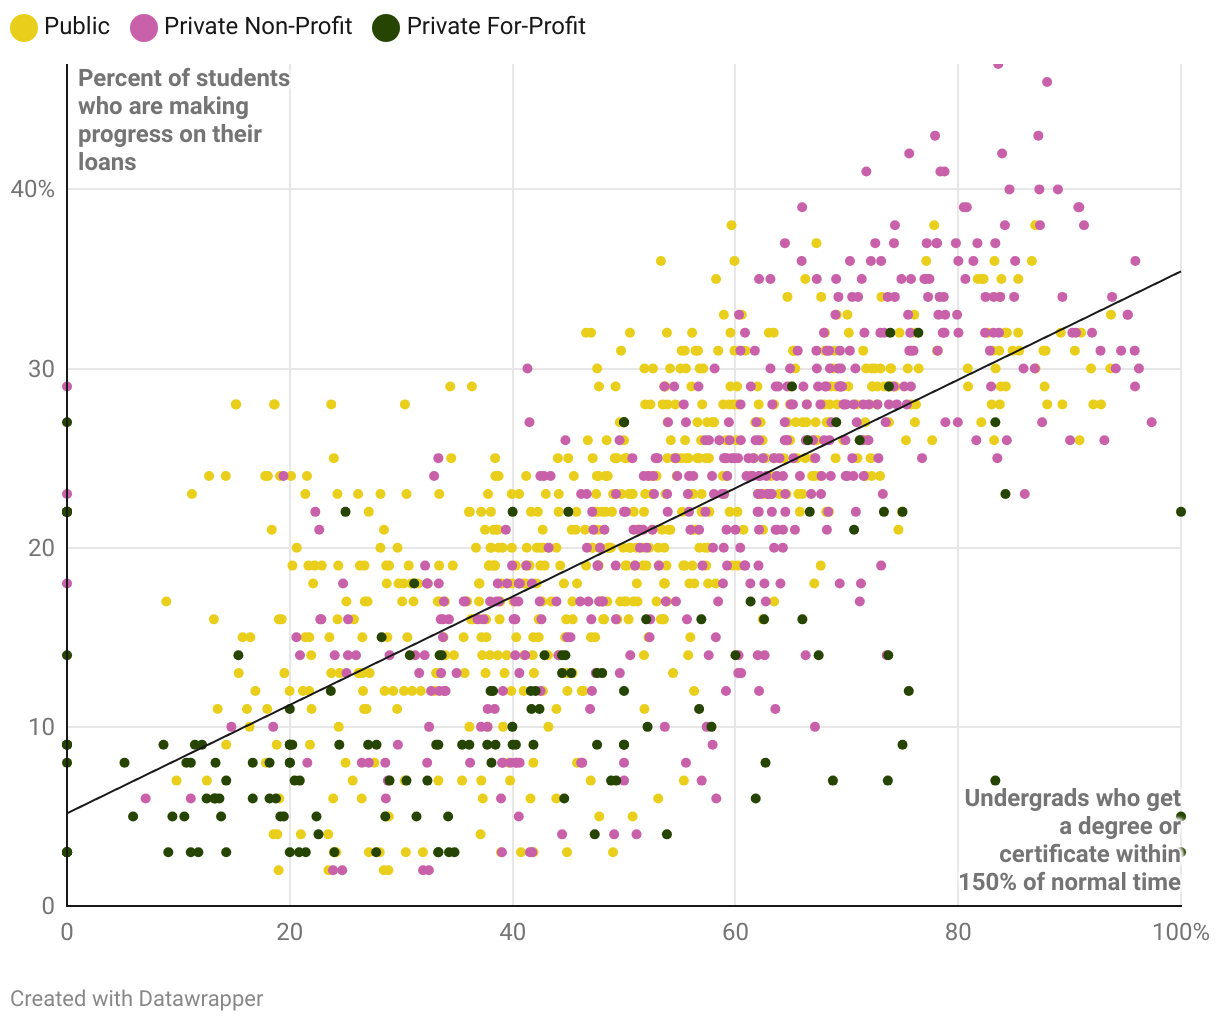
A scatter plot chart showing a correlation between schools’ repayment progress and the share of undergrads who get a degree within 150% of normal time. (150% of normal time for a 2-year program is 3 years and for a 4-year program is 6 years.) The lower the rate of completion, the lower the percentage of students who are making progress on their loans after three years. The higher the rate of completion, the higher share of students who are making progress on their loans. Each dot in the scatter plot is a different school in the College Scorecard database.