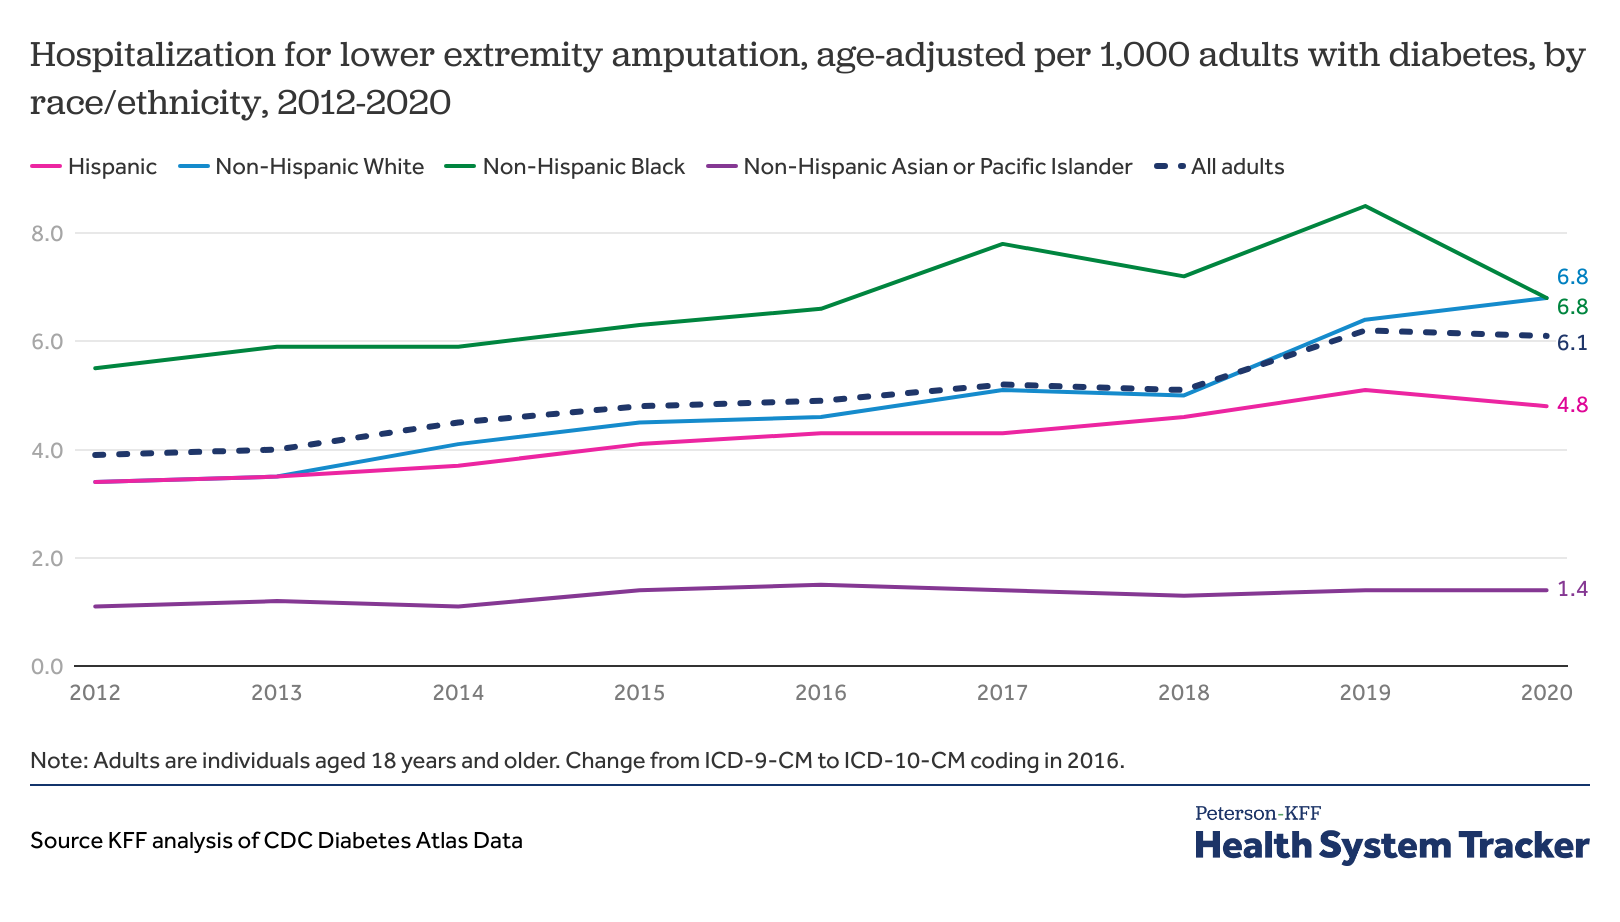
Hospitalization for lower extremity amputation, age-adjusted per 1,000 adults with diabetes, by race/ethnicity, 2012-2020
Line chart showing five lines, one for each race/ethnicity and an overall line. Showing slightly increasing trends for non-Hispanic Black adults and for non-Hispanic White adults. Other rates are steady. Rate of adults aged 18 years or older with diagnosed diabetes hospitalized for lower extremity amputation, 2012-2020.
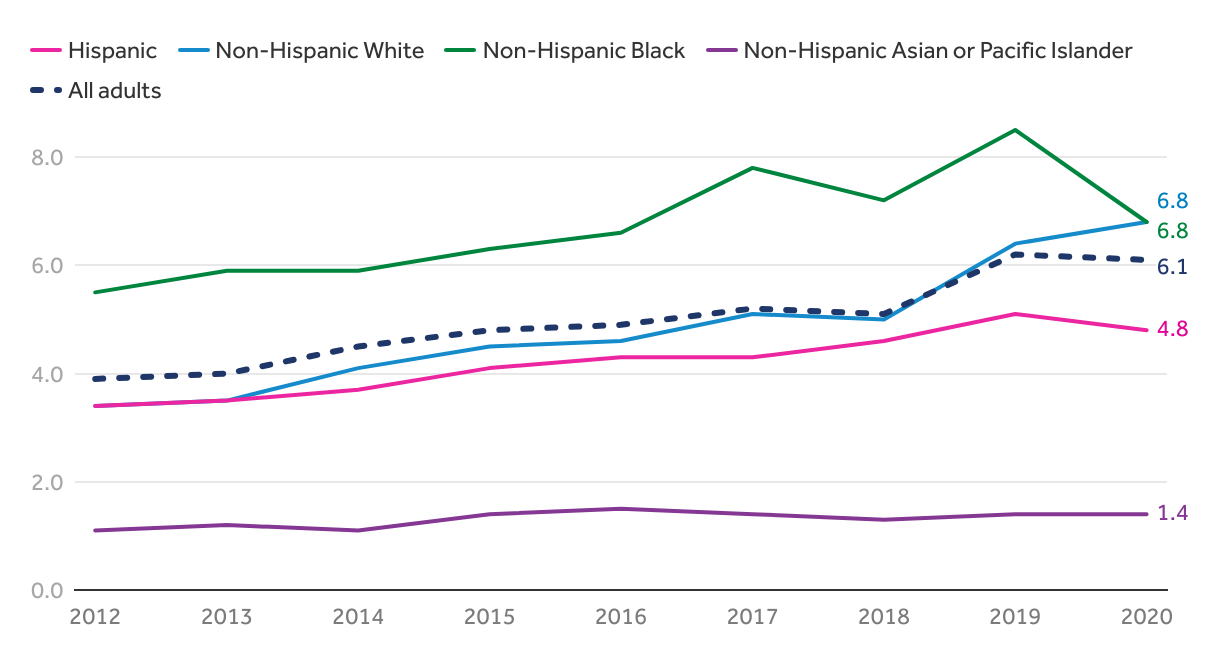
Note: Adults are individuals aged 18 years and older. Change from ICD-9-CM to ICD-10-CM coding in 2016.