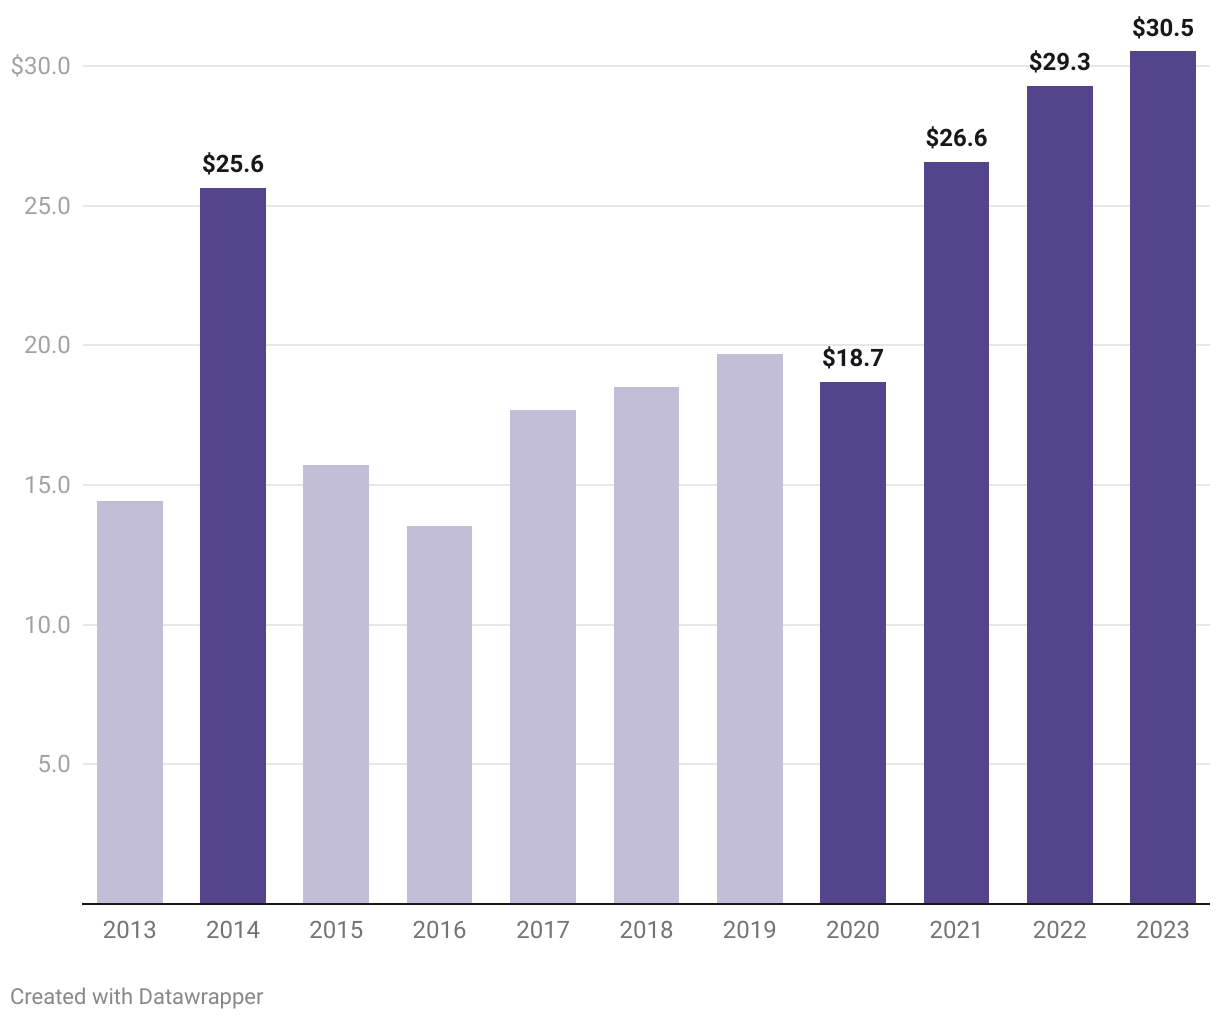
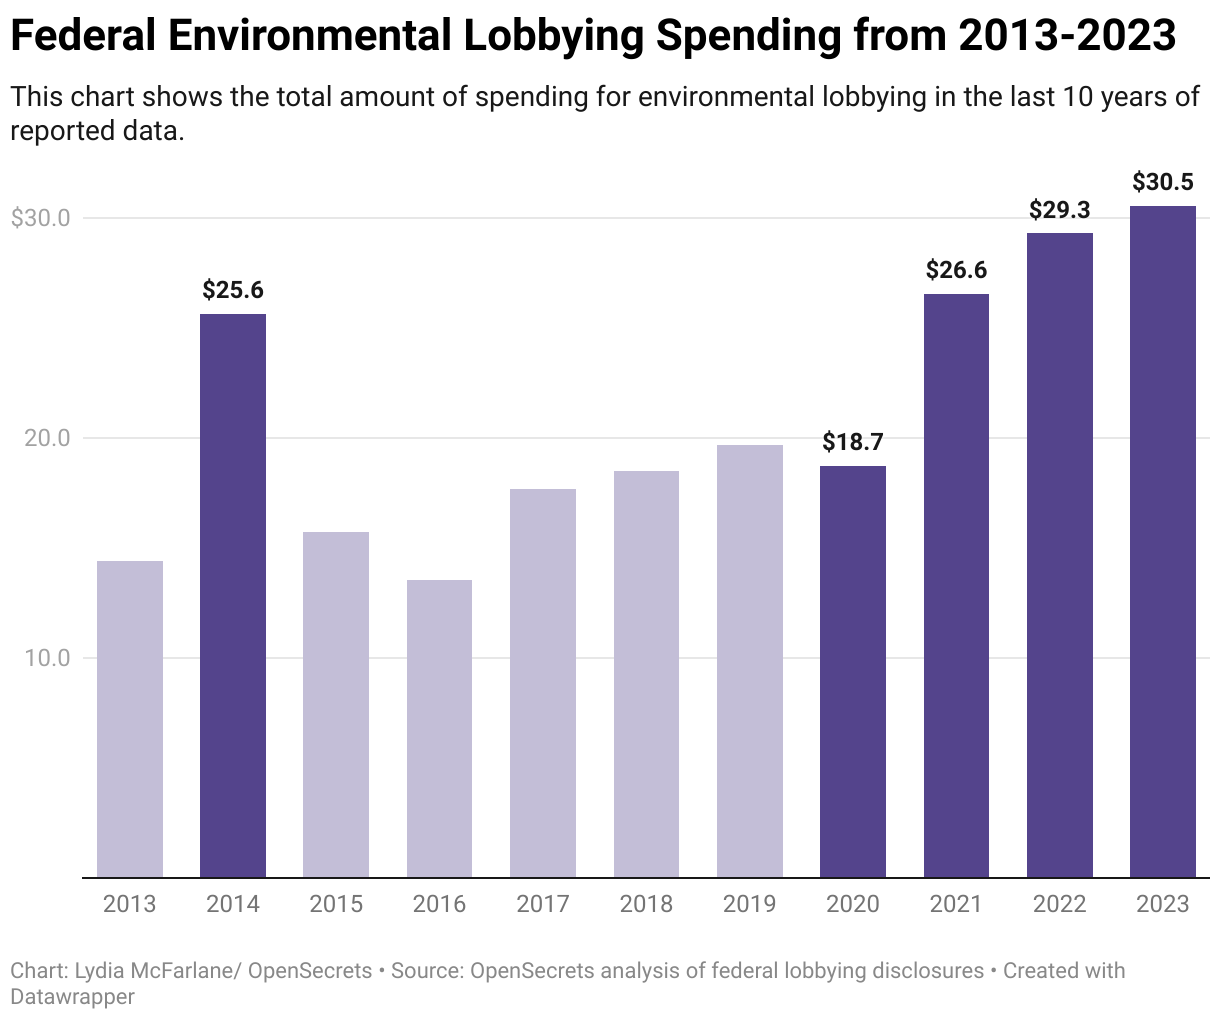
Federal Environmental Lobbying Spending from 2013-2023
This chart shows the total amount of spending for environmental lobbying in the last 10 years of reported data.
Spending on environmental lobbying has been rising since it last spiked in 2014, and noticeably so since the beginning of Biden's presidency.