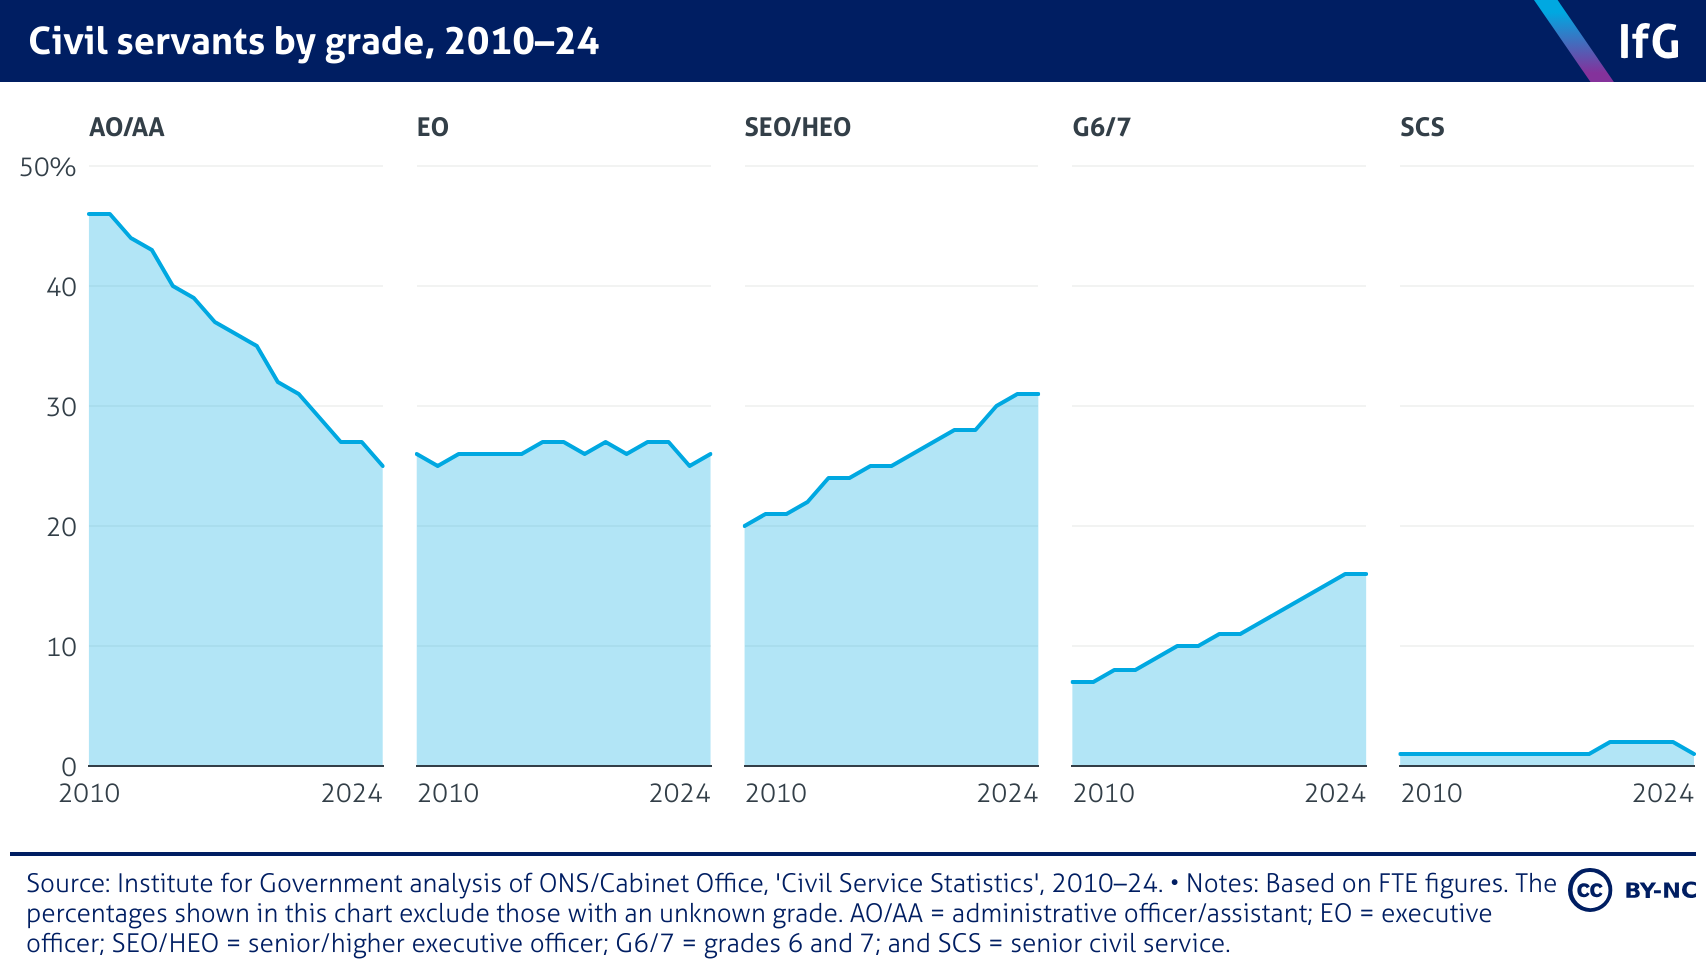
Civil servants by grade, 2010–24
A series of five line charts from the Institute for Government, each representing a grade in the civil service. Each chart shows the proportion of the civil service each grade made up between 2010 and 2024. The most junior AO and AA grades have made up a steadily decreasing proportion of the civil service since 2010, while EOs have held steady, and the more senior SEO/HEO and grade 6s and 7s have been increasing steadily as a proportion of the overall civil service.

