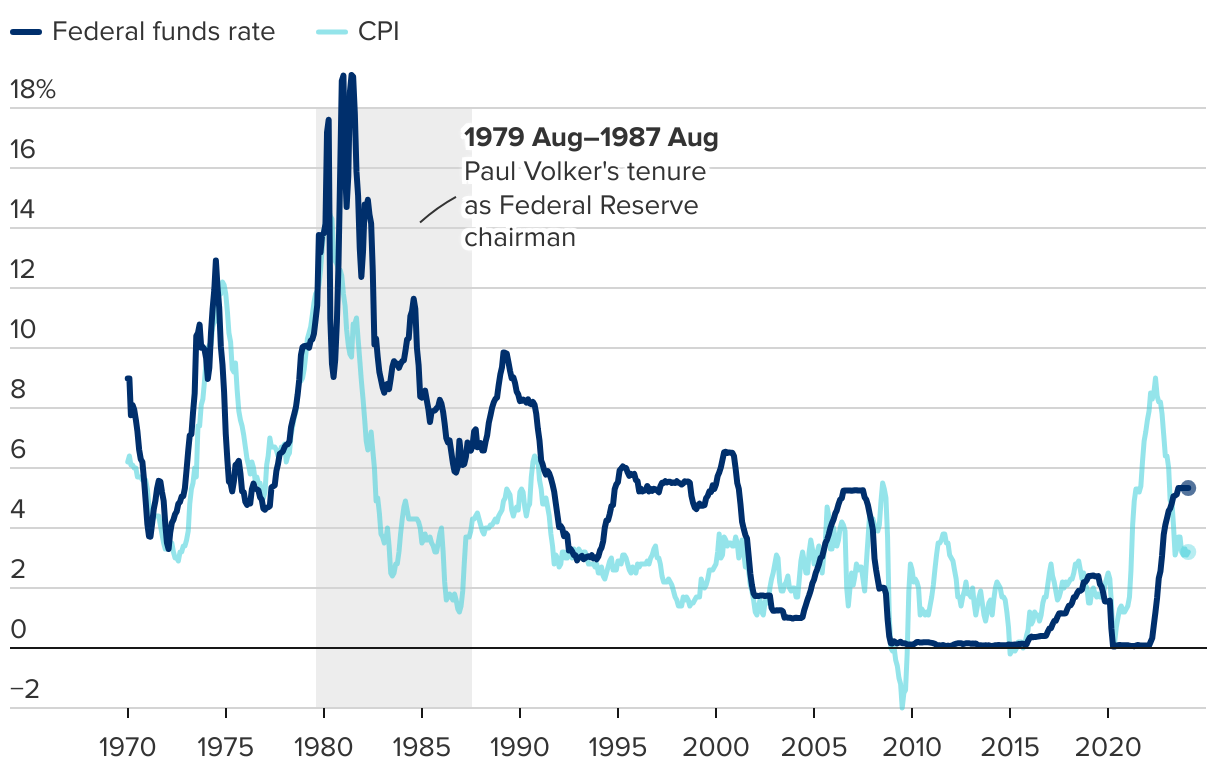
U.S. federal funds rate and the consumer price index
January 1970–February 2024
Two line charts juxtapose the U.S. federal funds rate and the 12-month percent change in the consumer price index from January 1970 through February 2024.
January 1970–February 2024