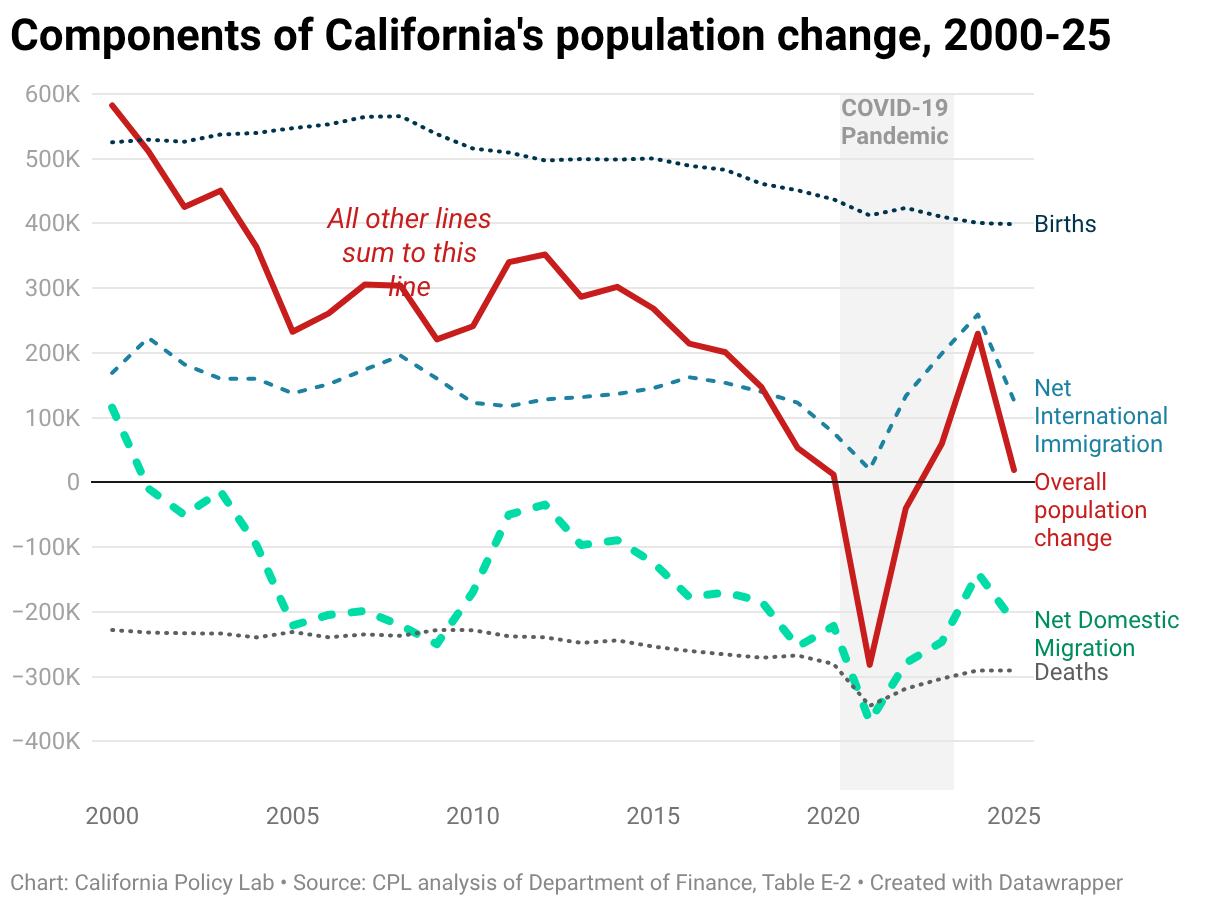
Components of California's population change, 2000-25
A line graph breaking down California's population change from 2000 to 2024 into four components: Births, Deaths, Net International Immigration, and Net Domestic Migration (consistently negative). The "Overall population change" (solid red line) shows a sharp drop into negative territory during the COVID-19 pandemic (2020-2022) due to a spike in net domestic migration and a drop in international arrivals, with a slight recovery toward zero growth, post-pandemic.
