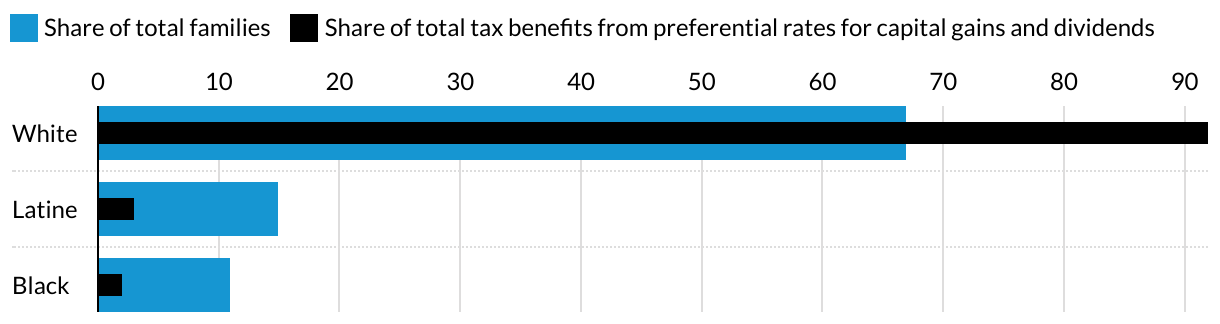
Share of total families versus share of total tax benefits, by race and ethnicity, 2023
Bullet bar chart that compares what share of families, by race, benefit from the preferential rates for capital gains and dividends to share of all families, by race. White families disproportionately benefit from the lower rates on capital gains.