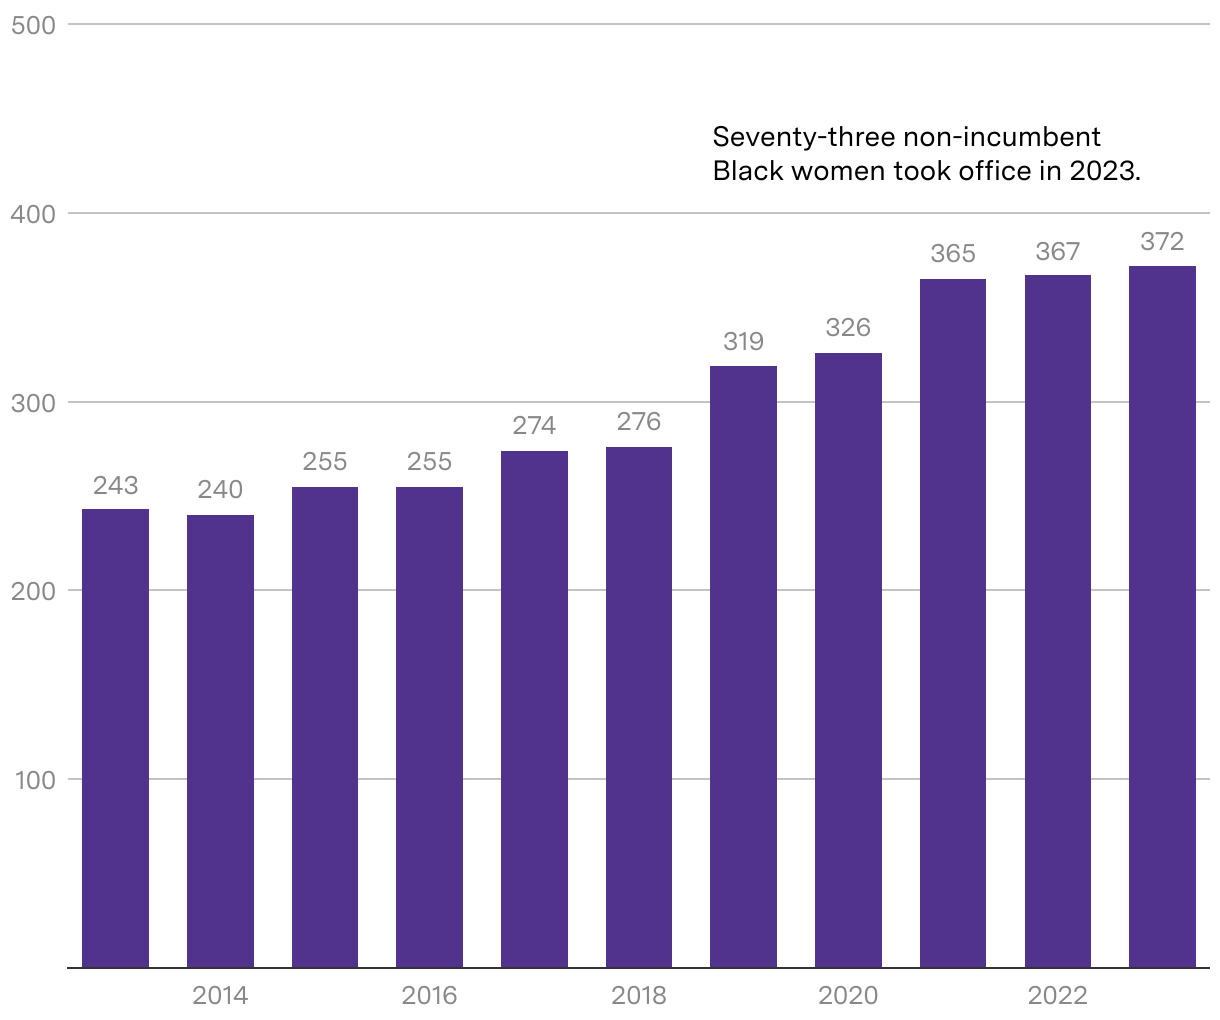
A record number of Black women are serving in state legislatures
Number of Black women serving in state legislatures by year, 2013-2023
Column chart showing a pattern of steady increase in Black women’s representation in state legislatures, starting at 243 serving in 2013 and ending with 372 serving in 2023. There is an annotation noting that Seventy-three non-incumbent Black women took office in 2023.