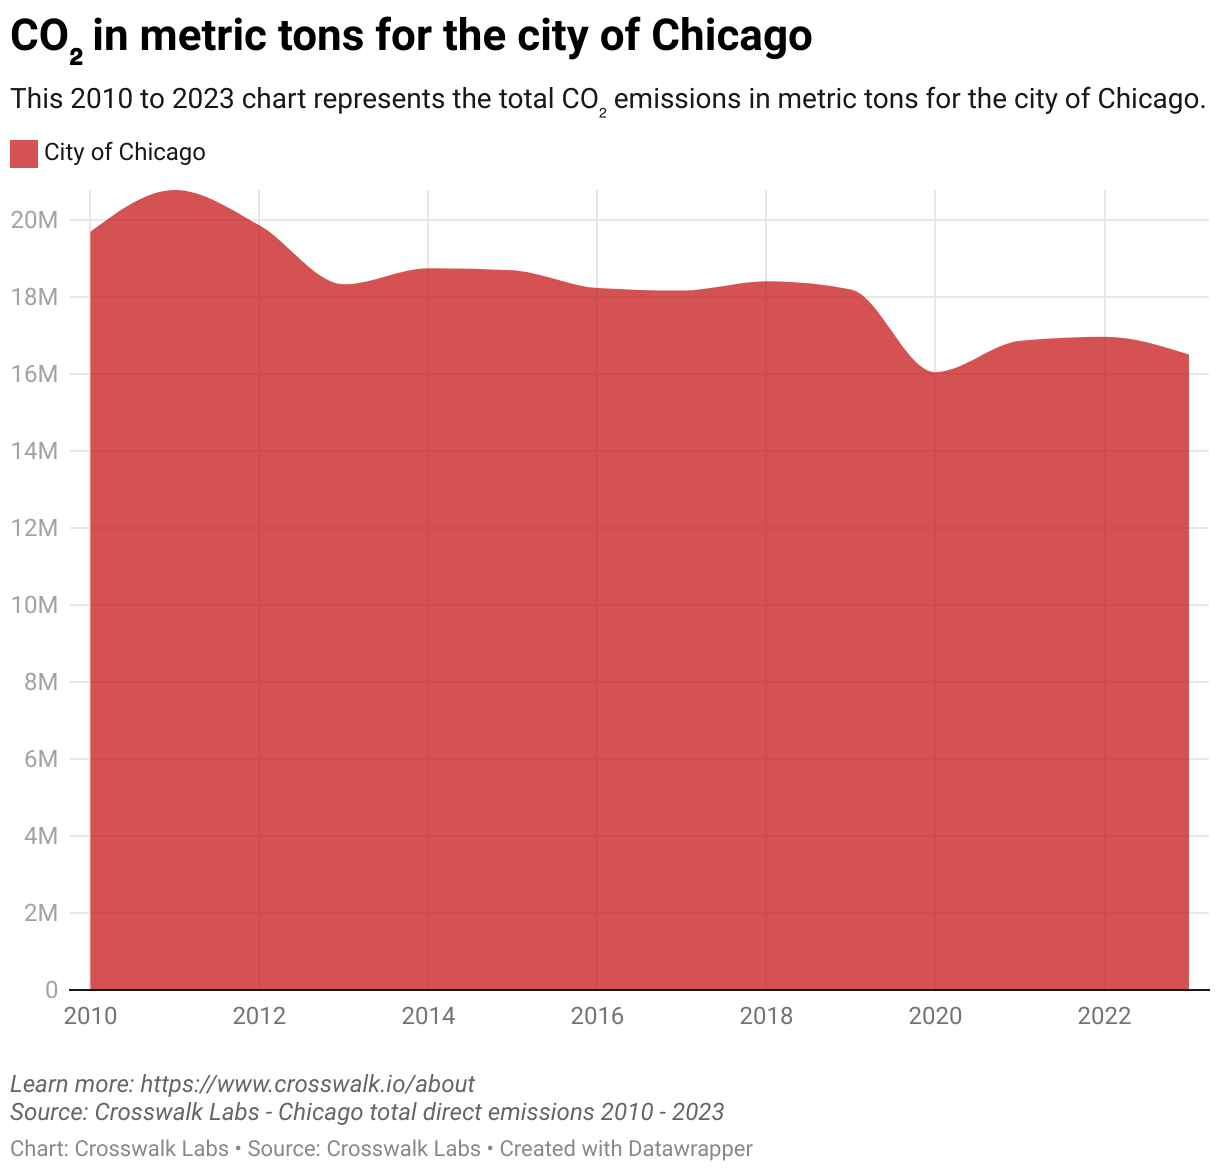
This 2010 to 2023 chart represents the total CO₂ emissions in metric tons for the city of Chicago.
(Please use a modern browser to see the interactive version of this visualization)
