Medi-Cal visits to clinics increased before the pandemic, with variation across regions

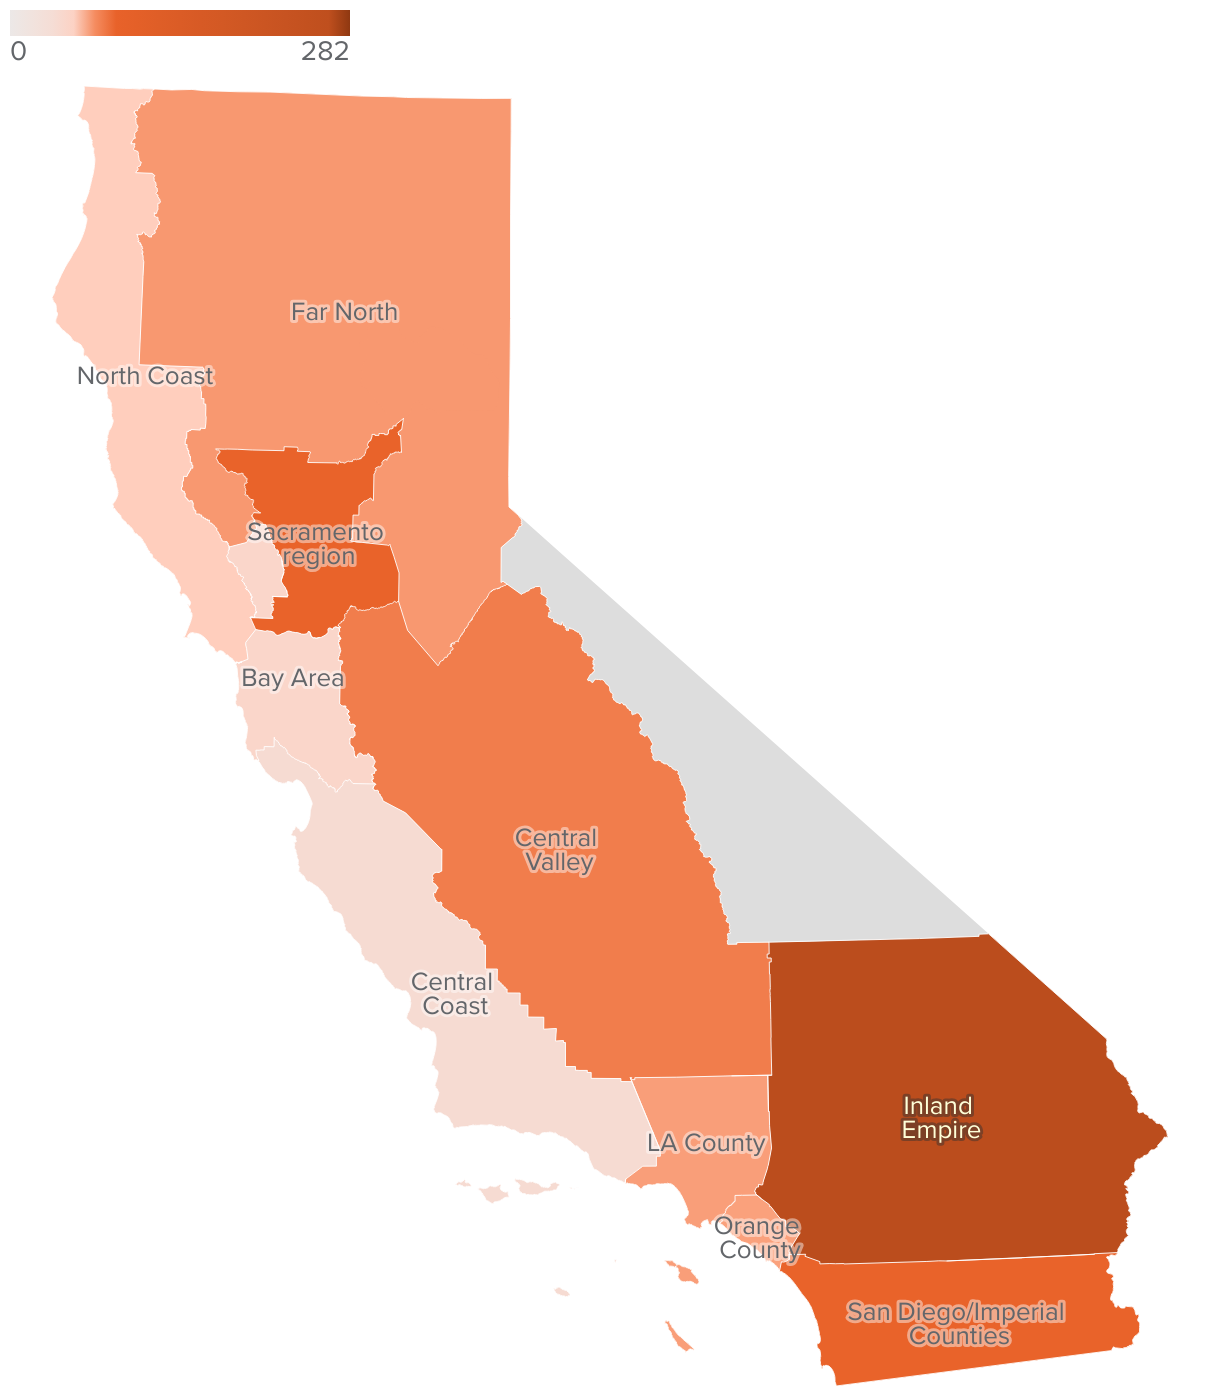
Percentage change in Medi-Cal visits from 2013 to 2019

Source: California Department of Health Care Access and Information—Primary Care Clinic Annual Utilization Data. NOTES: Figure shows the percentage change in Medi-Cal visits to primary care clinics licensed by the state between 2013 and 2019. Data from the years 2020 and 2021 are not included in the calculations due to the high number of non-responding clinics in the data during the pandemic. The region shaded in grey has no available data for primary care clinics. FROM: PPIC Blog, January 2024. Get the data Embed