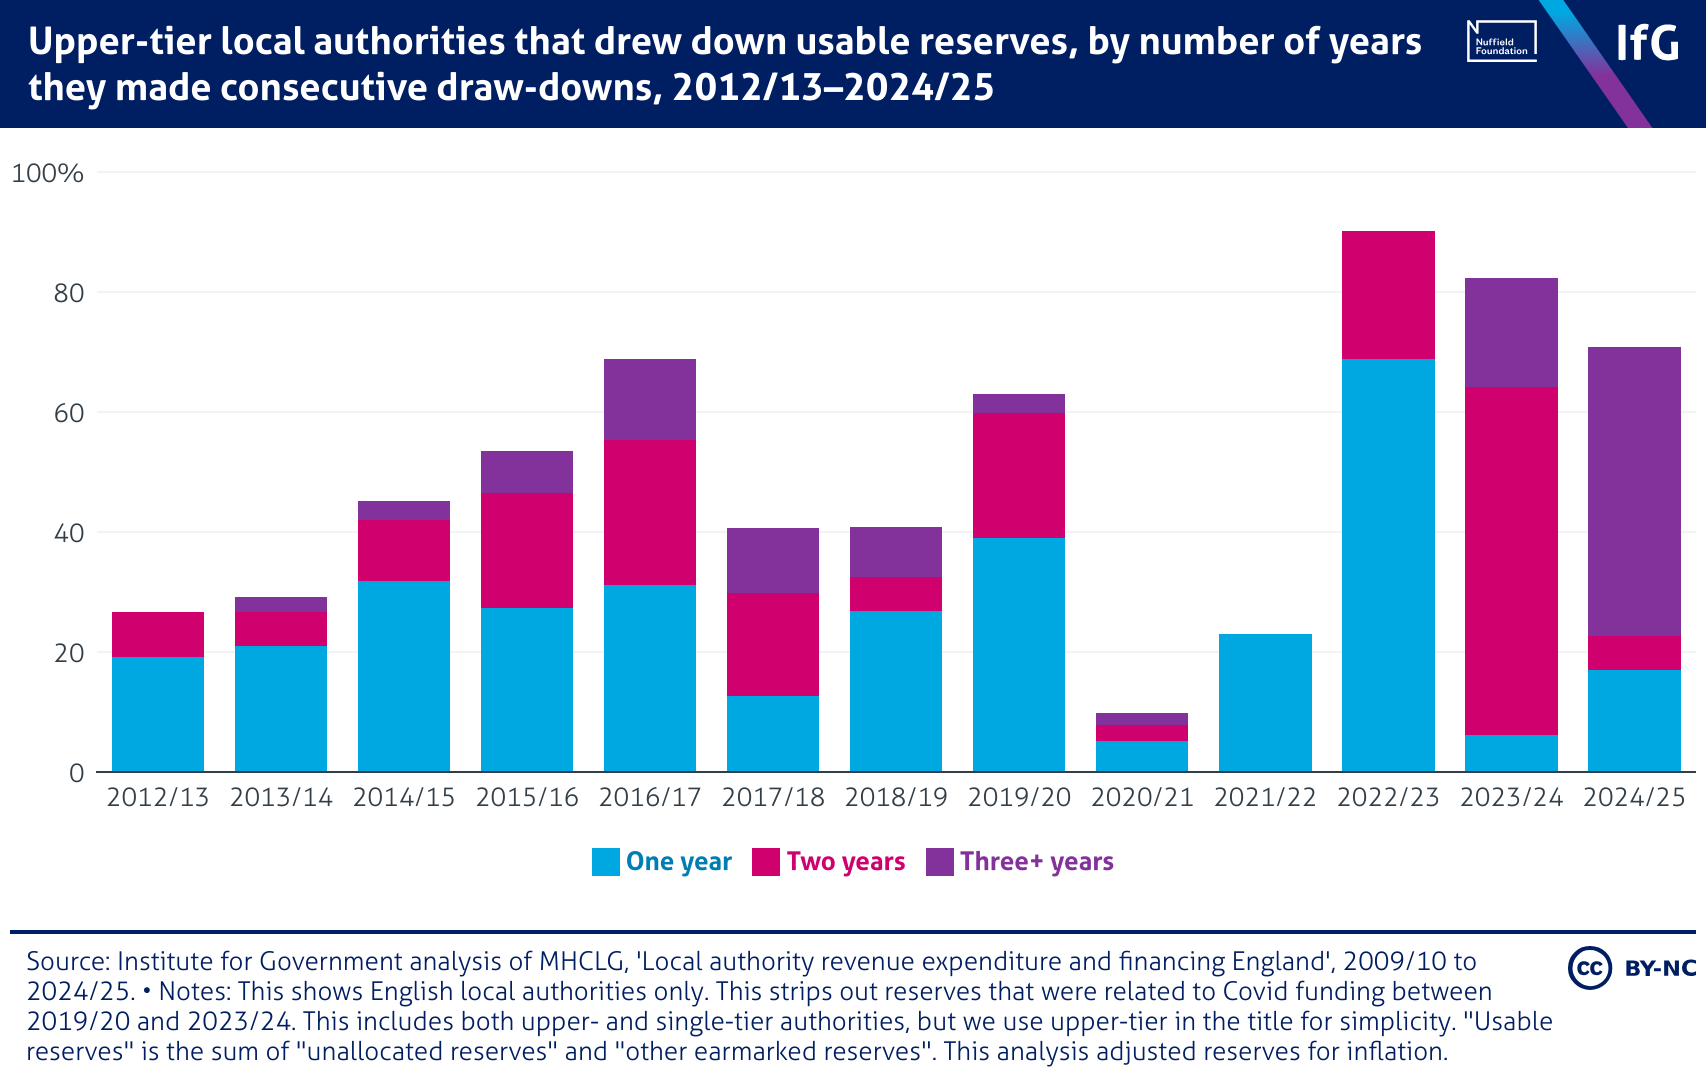
Upper-tier local authorities that drew down usable reserves, by number of years they made consecutive draw-downs, 2012/13–2024/25

A stacked column chart from the Institute for Government of upper-tier local authorities that drew down reserves, by number of years they made consecutive draw-downs, 2012/13–2024/25, where one year draw-downs are most common throughout, with peaks in two and three plus year draw-downs in 2016/17, and again in 2023/24 and 2024/25.

