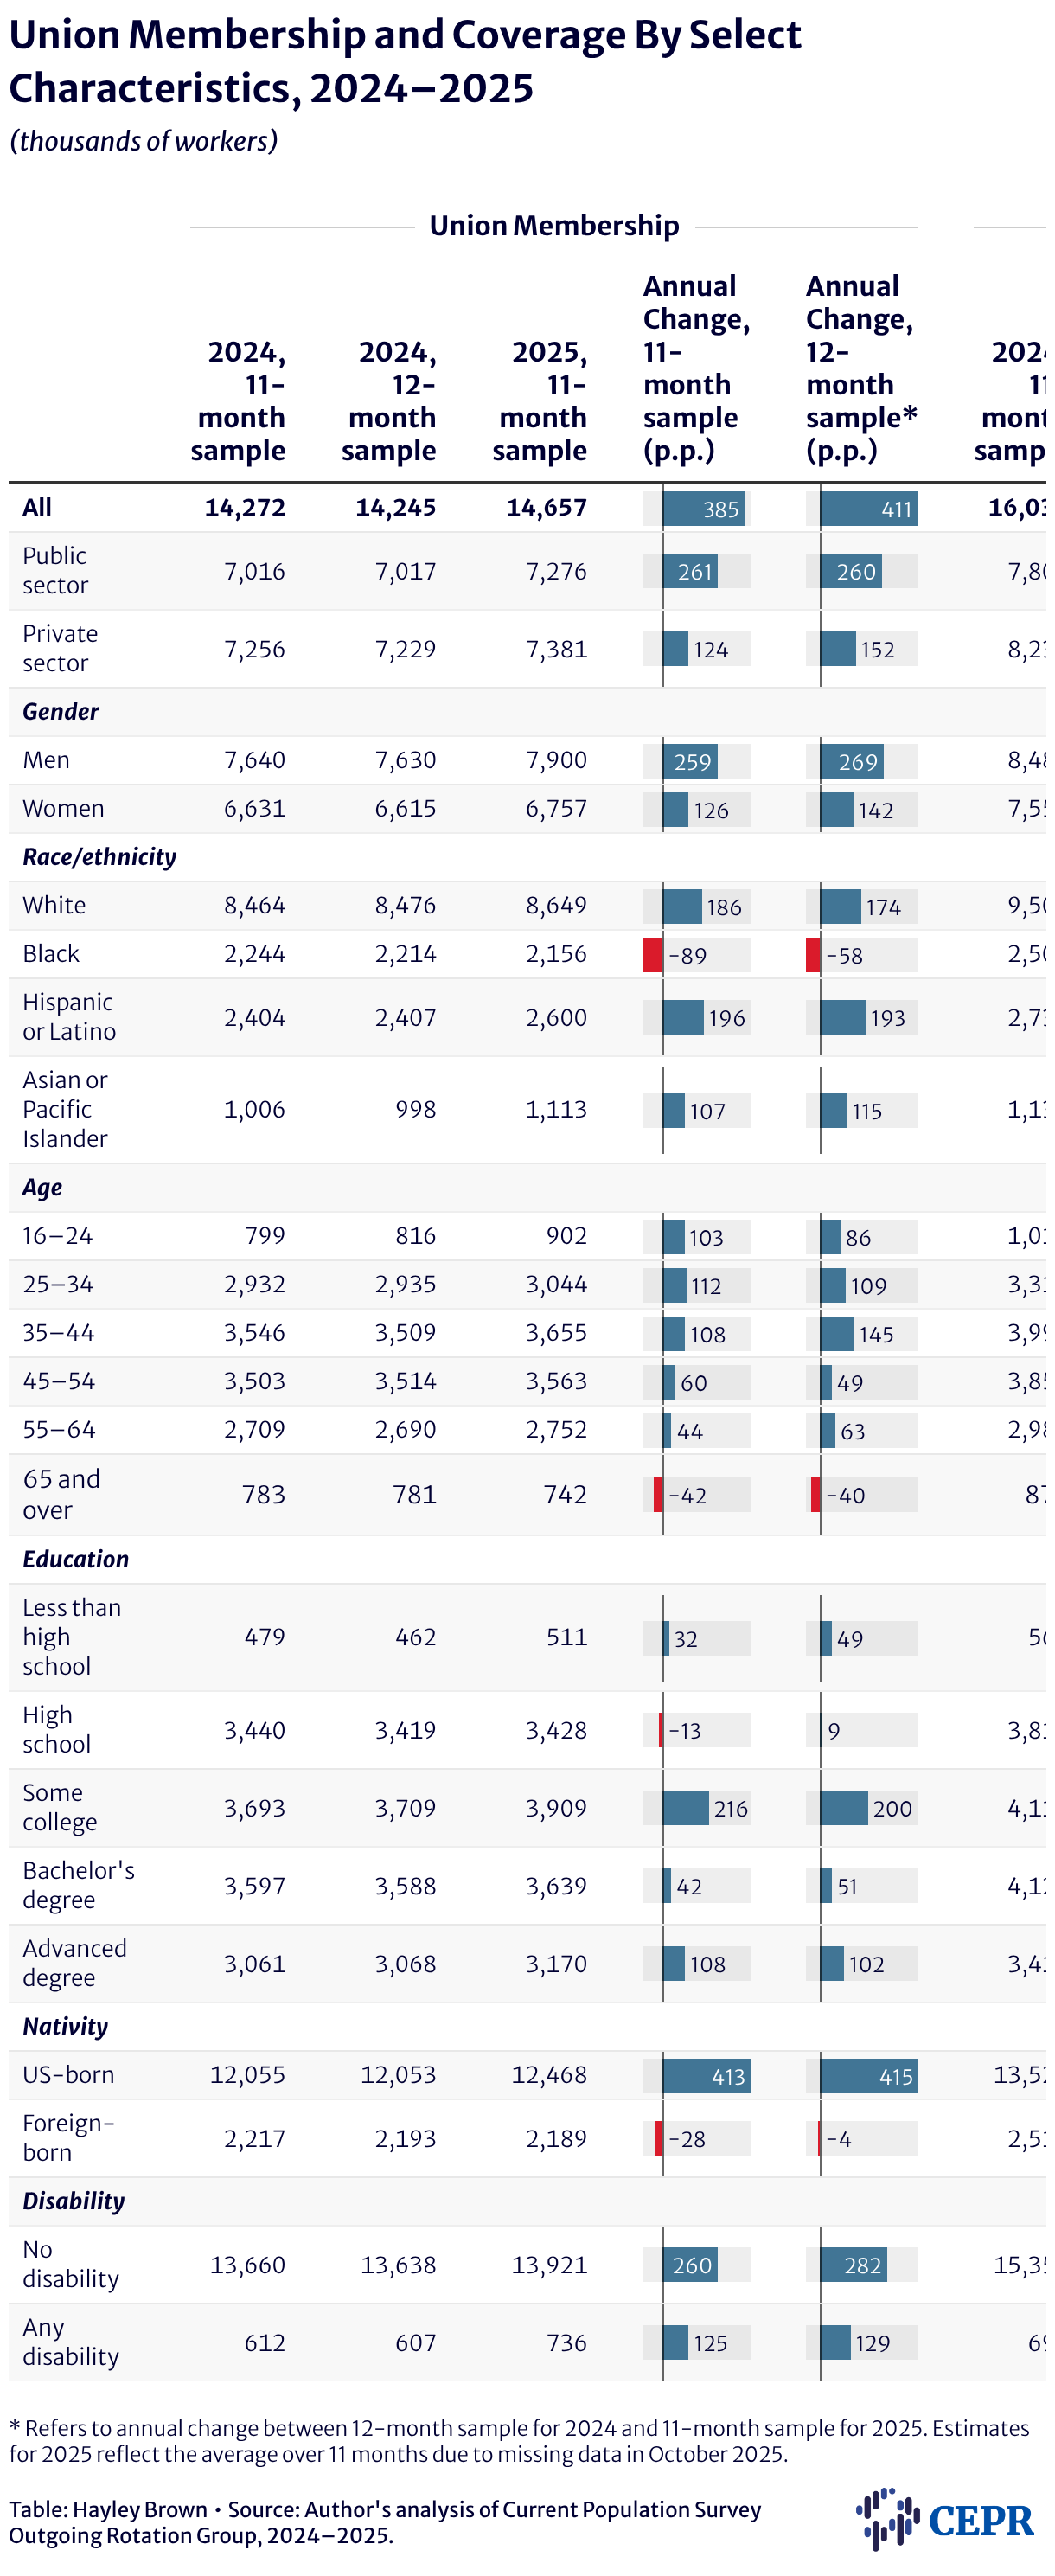
Union Membership and Coverage By Select Characteristics, 2024–2025
(thousands of workers)
Table showing union membership and coverage in thousands by sector and by select demographic characteristics for 2024 and 2025. Includes values for both the 11-month and 12-month samples for 2024. Year-over-year changes using both samples are shown as bar charts within the table, with positive changes in blue and negative changes in red.

* Refers to annual change between 12-month sample for 2024 and 11-month sample for 2025. Estimates for 2025 reflect the average over 11 months due to missing data in October 2025.