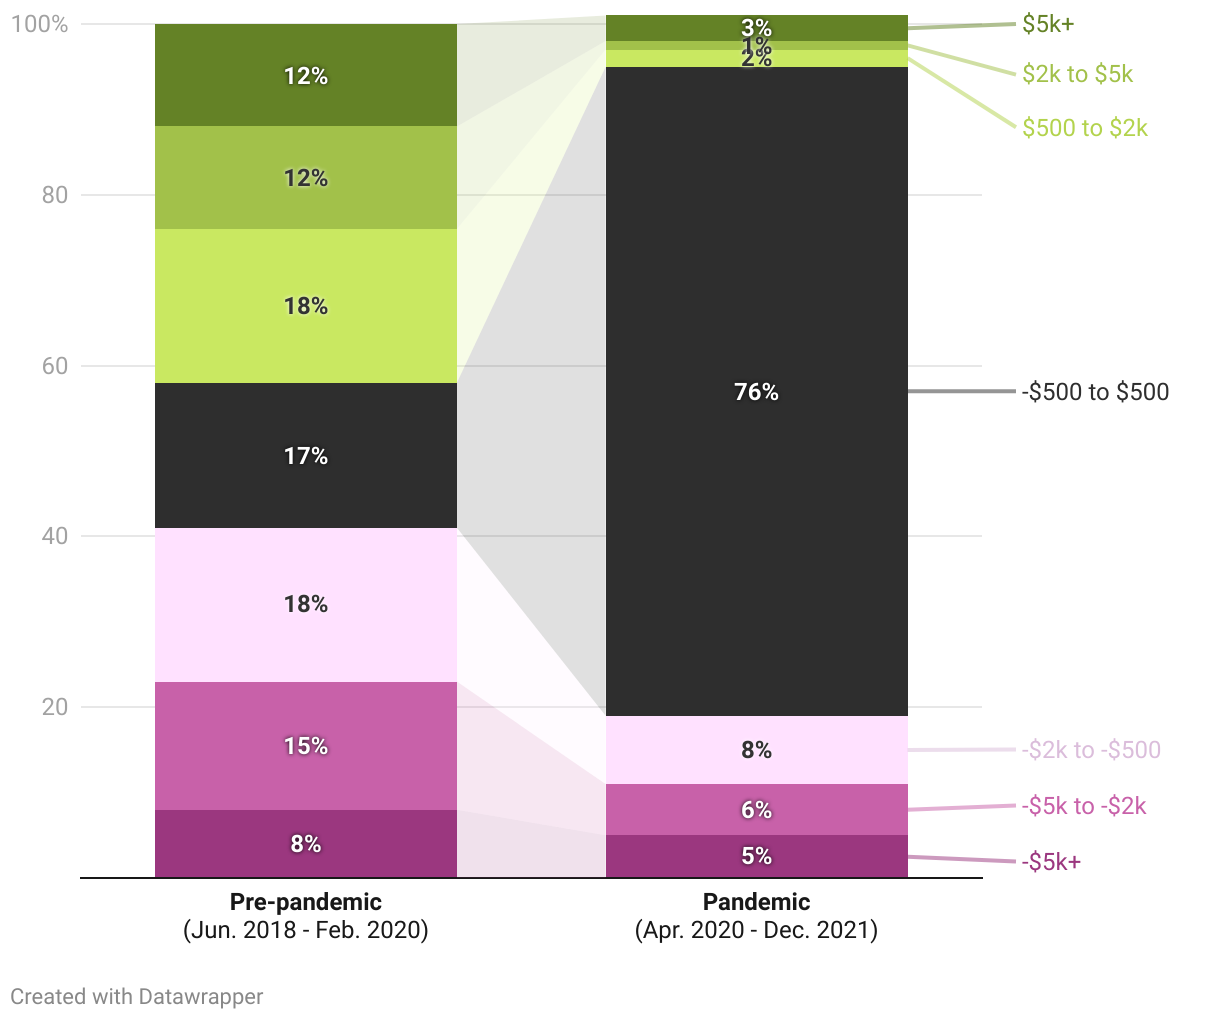
A data visual showing two periods: a stacked bar chart for a pre pandemic period and a stacked bar chart next to it for a pandemic period. Each stacked bar shows change in loan balances for each period. For pre-pandemic, 42% of borrowers were seeing balances increase, compared to only 6% during the pandemic. Meanwhile, 41% saw balances go down pre-pandemic compared to 19% during the pandemic. The biggest change was for those whose balances didn’t move. Only 17% of people saw no or little change in their balances pre-pandemic but 76% fell into that category during the pandemic.
Most borrowers made no significant payments on their loans during the pandemic
Borrowers with direct federal loans