NAACP Lawsuits and Teachers' Salaries in Southern States
Difference in salary growth between states that adopted minimum
salary schedules vs linked teacher pay to standardized testing (log scale)
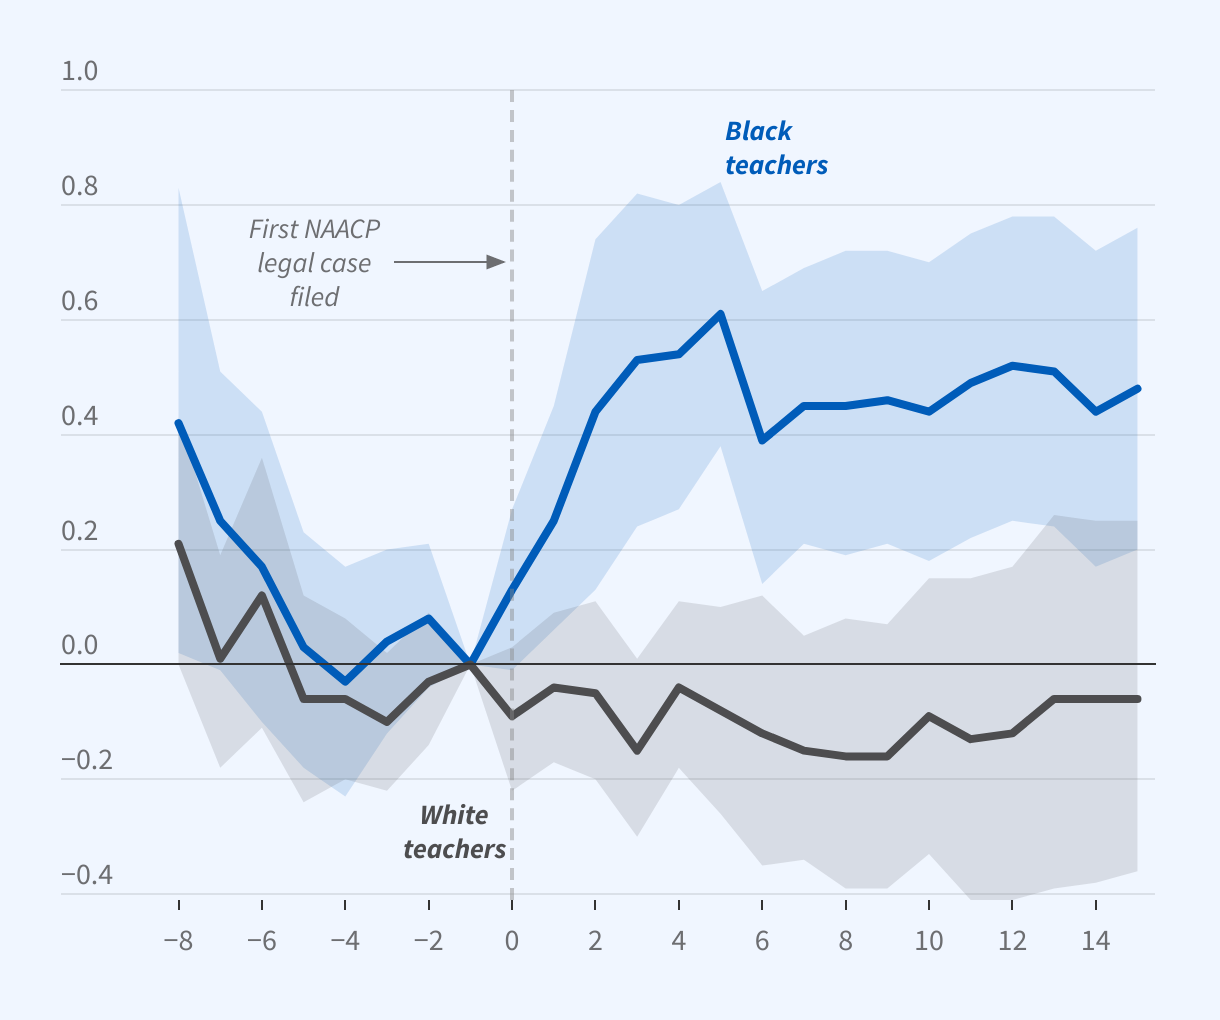
The graph is an event-study chart titled, “NAACP Lawsuits and Teachers' Salaries in Southern States.”
The chart plots estimates of the difference in salary growth between states that adopted minimum salary schedules vs linked teacher pay to standardized testing (log scale), for both White and Black teachers.
The y-axis ranges from -0.4 to 1, and the x-axis ranges from 8 years before to 15 years after the first successfully filed NAACP legal case.
Five years after the first successful legal case filing, the estimate for Black teachers was 0.61, and the estimate for 15 years after was about 0.48. The estimates for White teachers are not statistically significant.
Source: Researchers' calculations using data from annual reports of state school superintendents in Alabama, Florida, Louisiana, South Carolina, Tennessee, and Virginia