Adelaide's kick-ins getting the job done
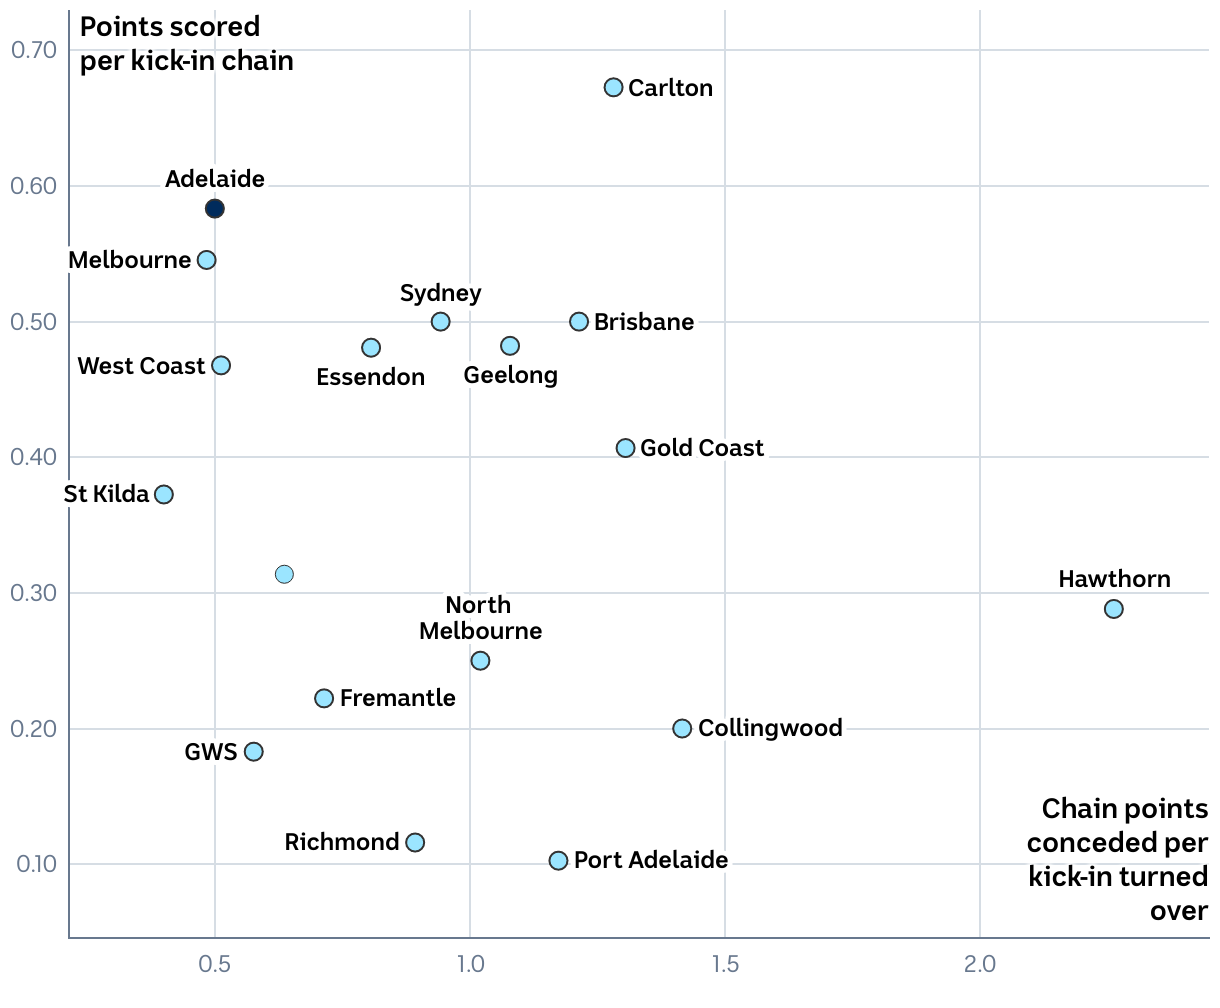
Scoring rate and turnover score conceding rate from kick-ins, 2023.
0.10
0.20
0.30
0.40
0.50
0.60
0.70
0.3
0.4
0.5
0.6
0.7
0.8
0.9
1.0
1.1
1.2
1.3
1.4
1.5
1.6
1.7
1.8
1.9
2.0
2.1
2.2
2.3
2.4
Adelaide
Adelaide
Carlton
Carlton
Hawthorn
Hawthorn
Melbourne
Melbourne
Port Adelaide
Port Adelaide
Richmond
Richmond
Chain points conceded per kick-in turned over
Points scored per kick-in chain