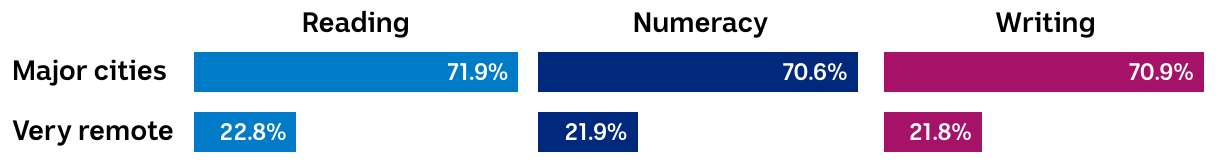
The percentage of students that rated ‘Strong’ or ‘Exceeding’
Graph showing the percentage of students who rated ‘Strong’ or ‘Exceeding’ in both major cities and remote areas
(Please use a modern browser to see the interactive version of this visualization)