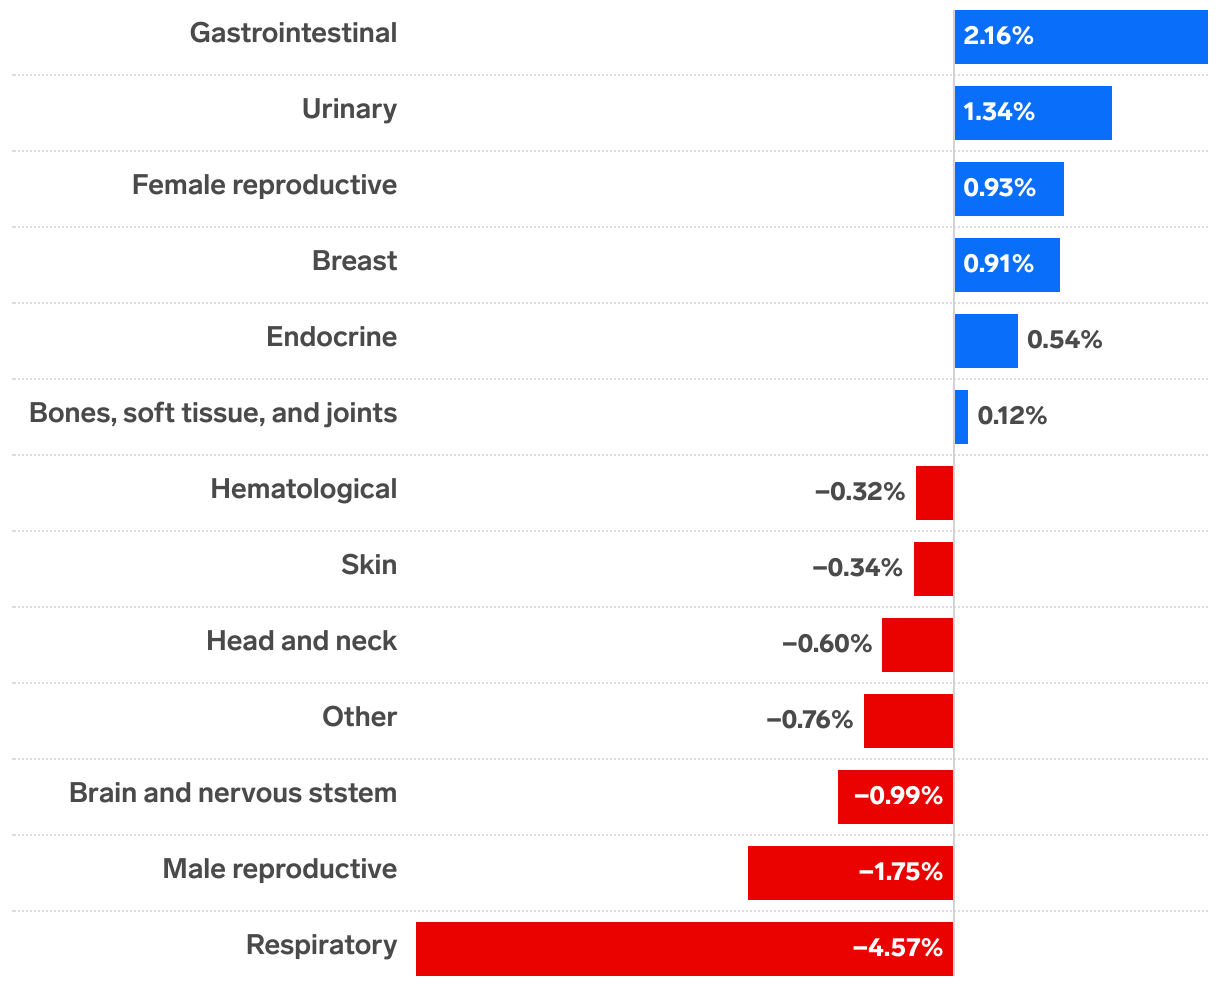
Annual percent change from 2010 to 2019, incidence of early-onset cancers
Chart showing the annual percent change from 2010 to 2019, incidence of early-onset cancers. Negative changes are in red and positive values are in blue.
(Please use a modern browser to see the interactive version of this visualization)