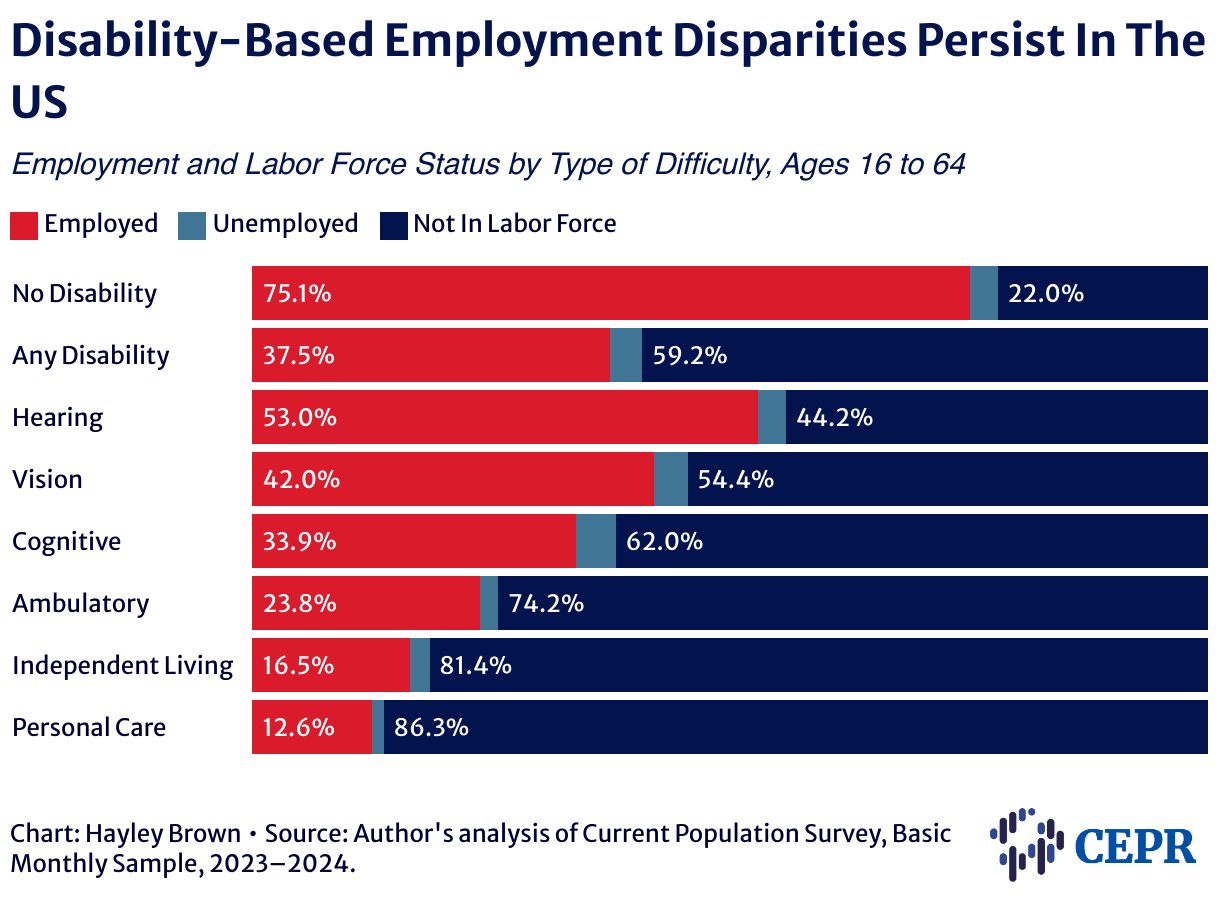
Disability-Based Employment Disparities Persist In The US
Employment and Labor Force Status by Type of Difficulty, Ages 16 to 64
This stacked bar chart shows the share of those ages 16 to 64 who were employed (red bars), unemployed (steel blue bars), and not in the labor force (navy bars) between 2023 and 2024, by disability status and type of difficulty. The types of difficulty shown include hearing, vision, cognitive, ambulatory, independent living (e.g. running errands), and personal care (e.g. dressing). Only 37.5 percent of those with a disability were employed, compared to 75.1 percent of those without a disability.
