Percentage change in primary school pupil numbers, 2018–19 to 2024–25

Note: Hexagons show aggregated school-level data, and do not represent geographic boundaries.
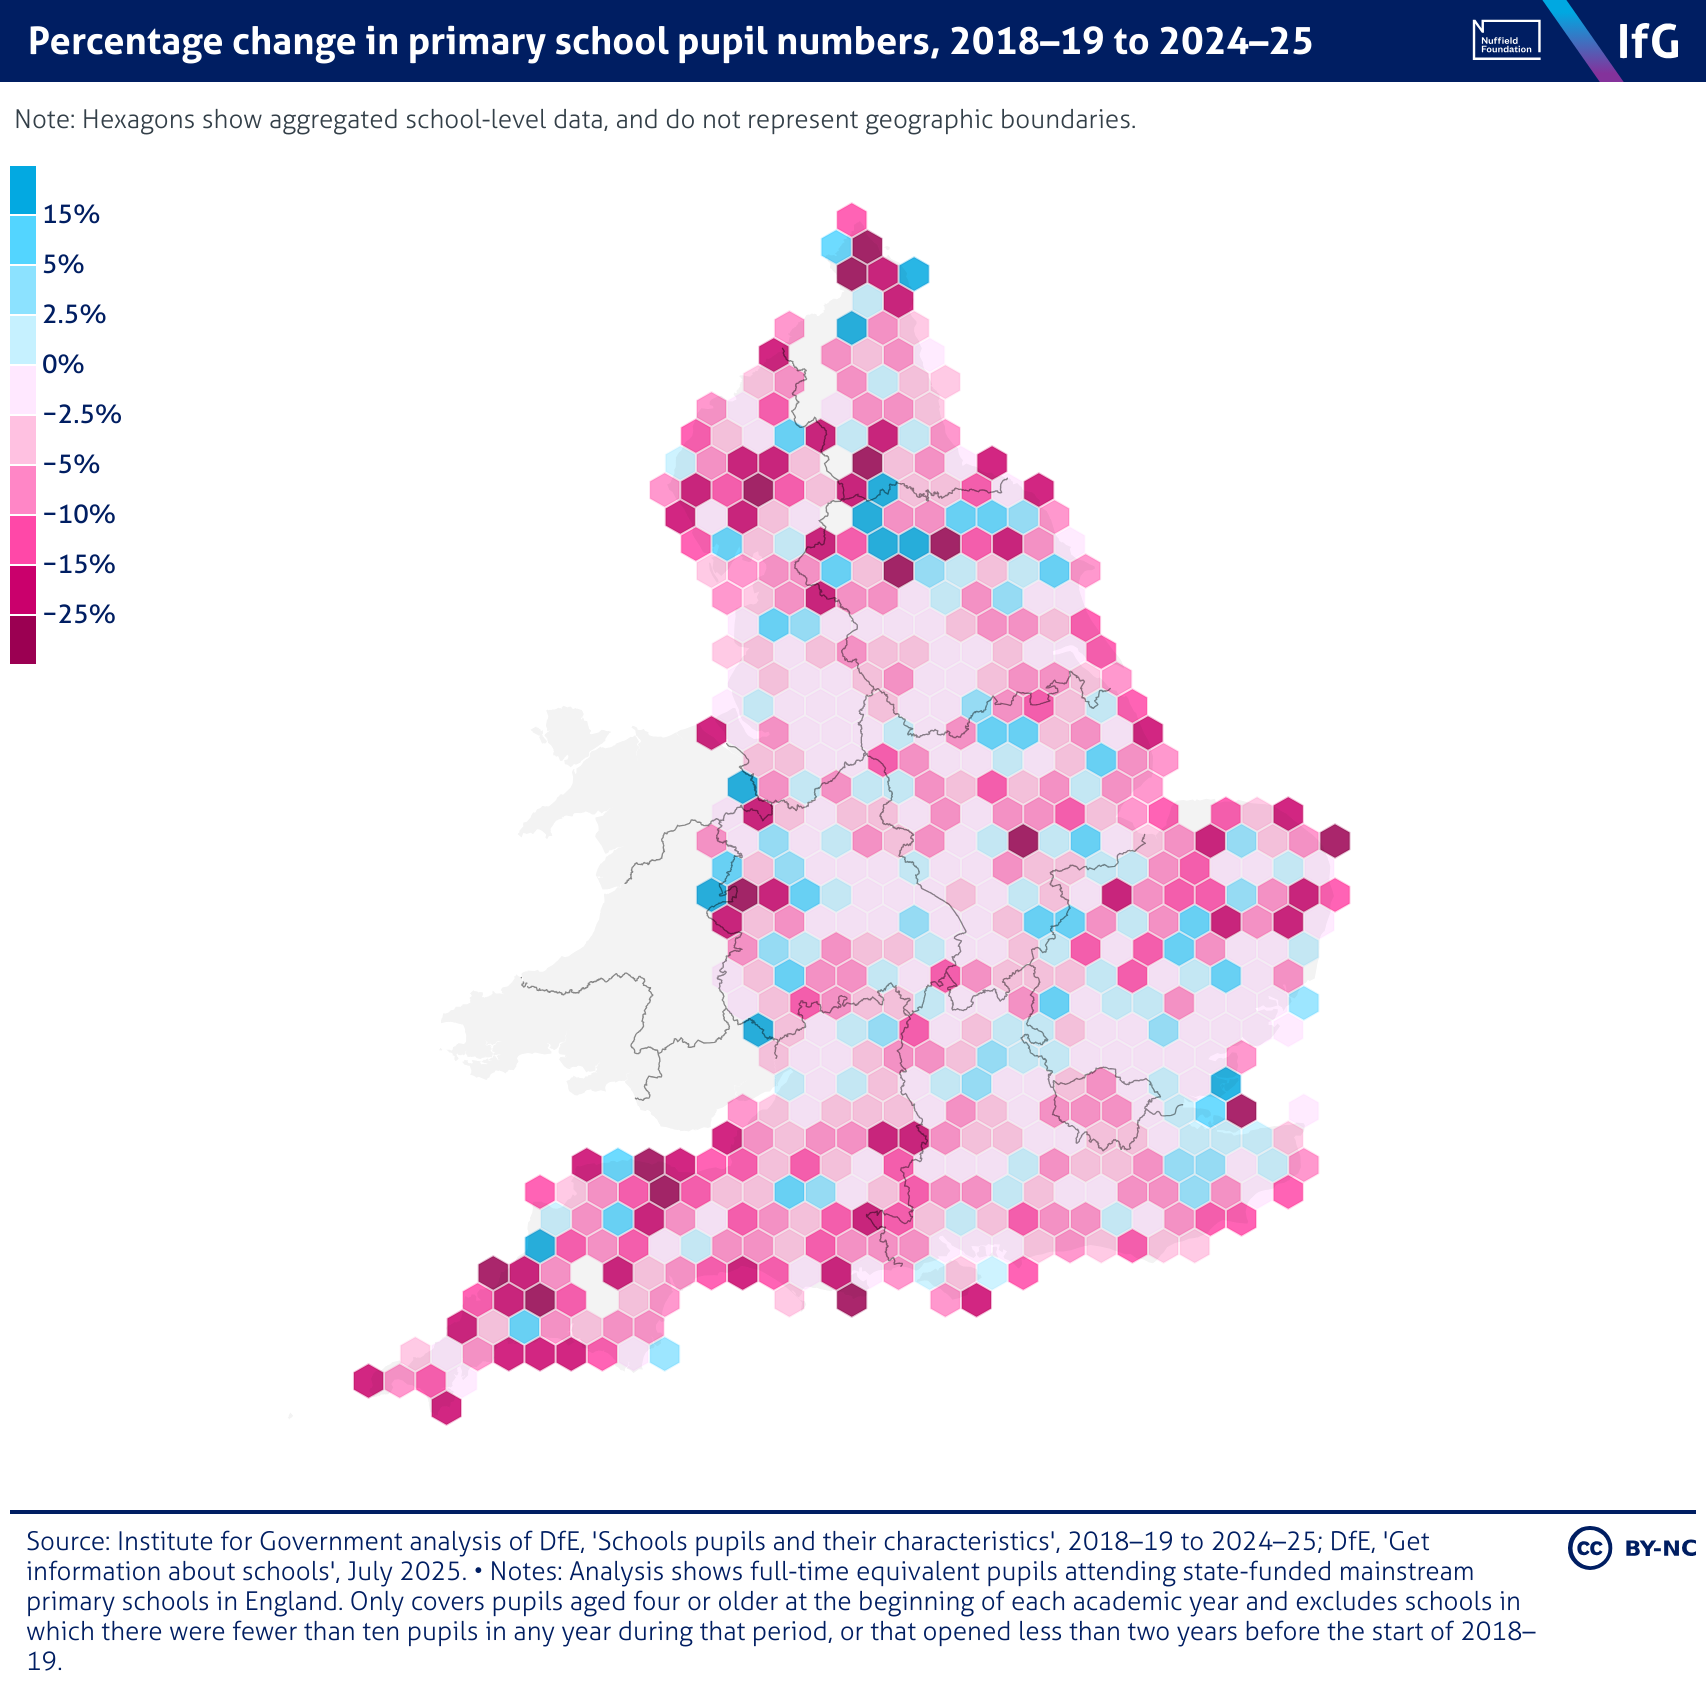
A hexmap from the Institute for Government of the percentage change in primary school pupil numbers, 2018–19 to 2024–25, where most areas of England have experienced declines in pupil numbers. The sharpest drops (shown in dark pink) are most concentrated in coastal areas. Some pockets of growth (shown in light blue) are primarily located inland.

