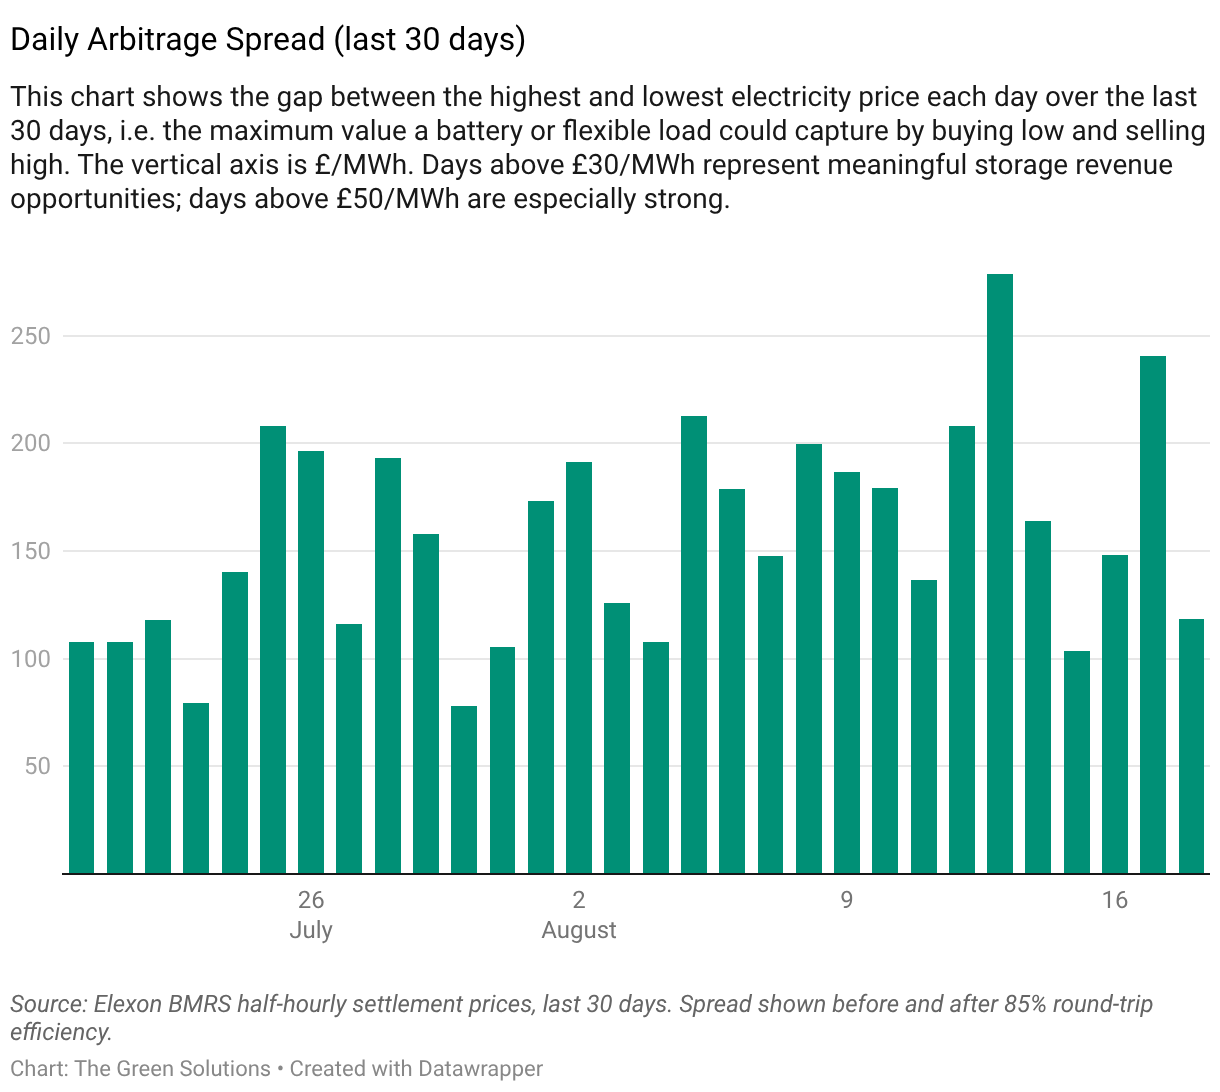
Daily Arbitrage Spread (last 30 days)
This chart shows the gap between the highest and lowest electricity price each day over the last 30 days, i.e. the maximum value a battery or flexible load could capture by buying low and selling high. The vertical axis is £/MWh. Days above £30/MWh represent meaningful storage revenue opportunities; days above £50/MWh are especially strong.