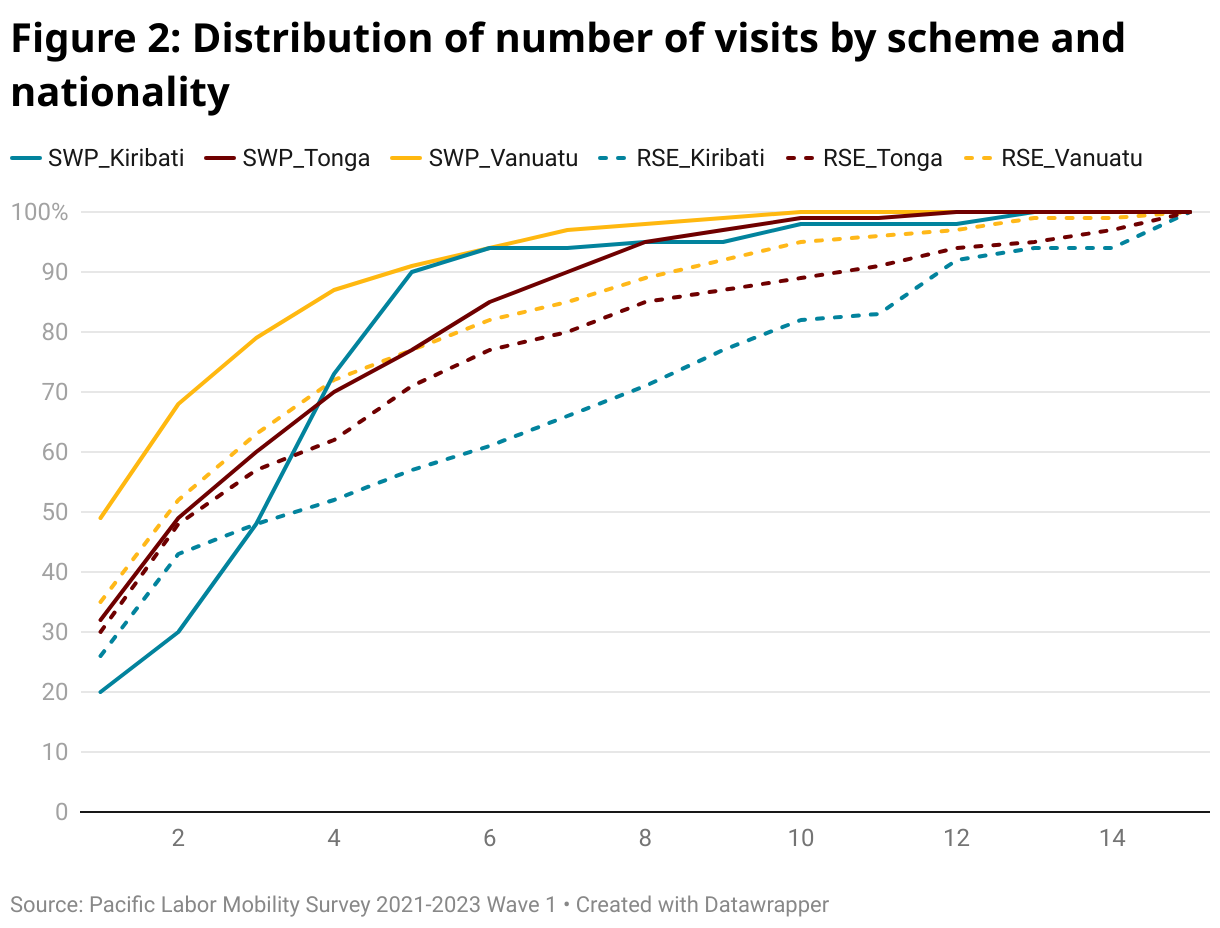
Figure 2: Distribution of number of visits by scheme and nationality
(Please use a modern browser to see the interactive version of this visualization)
